
- Start >
- Rivers >
- Waterlevel >
- Inn >
- Burghausen >
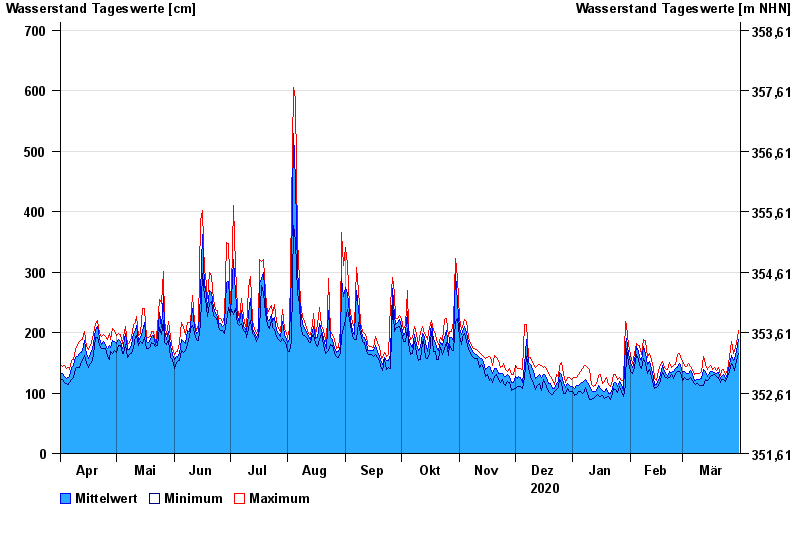
- Chart of year

Chart of year Burghausen / Salzach
Waterlevel from 01.04.2020 to 31.03.2021
- 03.06.2013 Wasserstand: 894 cm
- 14.08.1959 Wasserstand: 814 cm
- 13.08.2002 Wasserstand: 810 cm
- 09.07.1954 Wasserstand: 726 cm
- 03.06.2010 Wasserstand: 704 cm
| Date | Mean value [cm] | Maximum [cm] | Minimum [cm] |
|---|---|---|---|
| 31.03.2021 | 188 | 203 | 165 |
| 30.03.2021 | 169 | 182 | 153 |
| 29.03.2021 | 155 | 171 | 138 |
| 28.03.2021 | 154 | 165 | 142 |
| 27.03.2021 | 162 | 185 | 149 |
| 26.03.2021 | 147 | 160 | 135 |
| 25.03.2021 | 132 | 137 | 128 |
© Bayerisches Landesamt für Umwelt 2024