
- Start >
- Rivers >
- Waterlevel >
- Inn >
- Burghausen >
- Chart of total period

Chart of total period Burghausen / Salzach
Waterlevel from 30.08.1920 to 18.04.2024
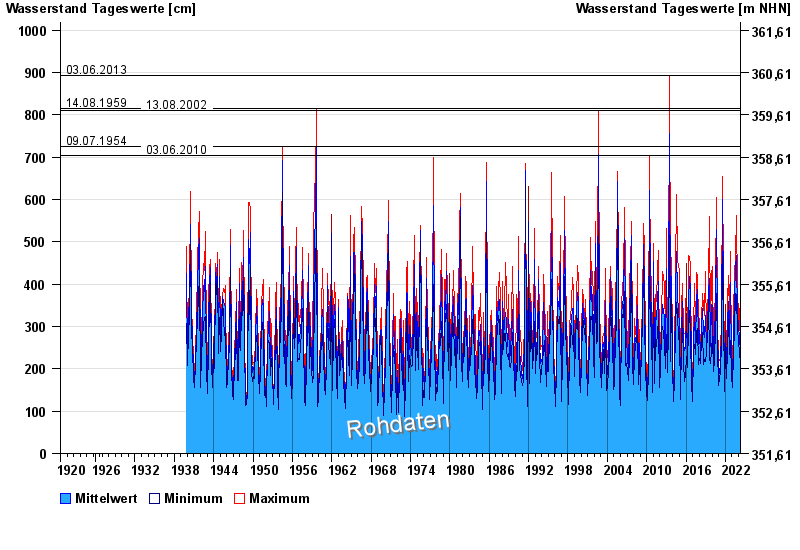
- 03.06.2013 Wasserstand: 894 cm
- 14.08.1959 Wasserstand: 814 cm
- 13.08.2002 Wasserstand: 810 cm
- 09.07.1954 Wasserstand: 726 cm
- 03.06.2010 Wasserstand: 704 cm
| Date | Mean value [cm] | Maximum [cm] | Minimum [cm] |
|---|---|---|---|
| 18.04.2024 | 216 | 222 | 204 |
| 17.04.2024 | 229 | 253 | 213 |
| 16.04.2024 | 256 | 282 | 217 |
| 15.04.2024 | 220 | 230 | 200 |
| 14.04.2024 | 208 | 217 | 193 |
| 13.04.2024 | 198 | 206 | 185 |
| 12.04.2024 | 194 | 198 | 186 |
© Bayerisches Landesamt für Umwelt 2024