
- Start >
- Rivers >
- Waterlevel >
- Inn >
- Bad Tölz B472 >
- Chart of total period

Chart of total period Bad Tölz B472 / Isar
Waterlevel from 20.11.2007 to 19.04.2024
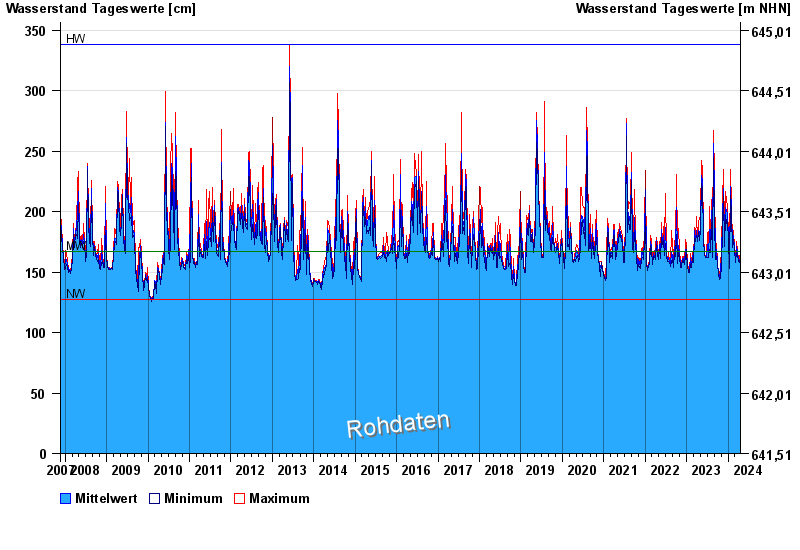
| Date | Mean value [cm] | Maximum [cm] | Minimum [cm] |
|---|---|---|---|
| 19.04.2024 | 162 | 163 | 161 |
| 18.04.2024 | 161 | 163 | 161 |
| 17.04.2024 | 159 | 162 | 157 |
| 16.04.2024 | 157 | 158 | 157 |
| 15.04.2024 | 157 | 158 | 156 |
| 14.04.2024 | 157 | 157 | 156 |
| 13.04.2024 | 157 | 157 | 157 |
© Bayerisches Landesamt für Umwelt 2024