
- Start >
- Rivers >
- Waterlevel >
- Inn >
- Bad Tölz >
- Chart of month

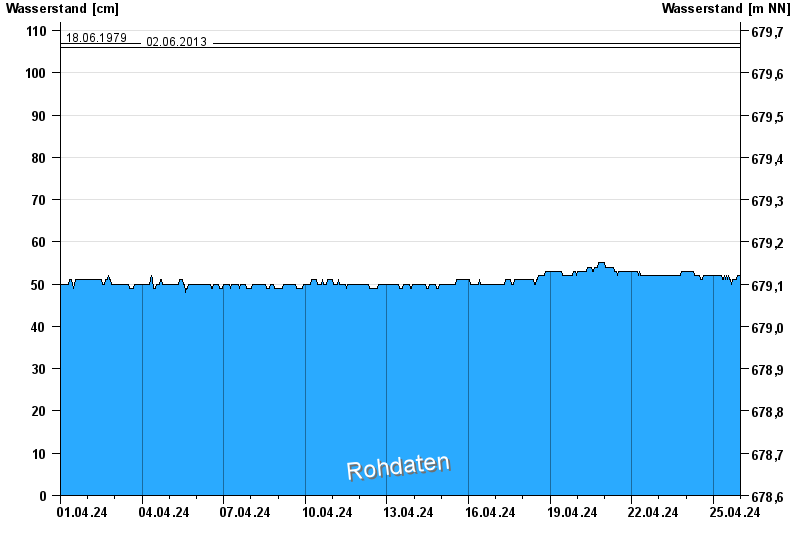
Chart of month Bad Tölz / Ellbach
Waterlevel from 01.04.2024 to 25.04.2024
- 21.05.1999 Wasserstand: 123 cm
- 23.07.1966 Wasserstand: 116 cm
- 10.09.2010 Wasserstand: 112 cm
- 18.06.1979 Wasserstand: 107 cm
- 02.06.2013 Wasserstand: 106 cm
| Date | Waterlevel [cm] |
|---|---|
| 25.04.2024 08:45 | 51 |
| 25.04.2024 08:30 | 51 |
| 25.04.2024 08:15 | 51 |
| 25.04.2024 08:00 | 51 |
| 25.04.2024 07:45 | 51 |
| 25.04.2024 07:30 | 51 |
| 25.04.2024 07:15 | 52 |
© Bayerisches Landesamt für Umwelt 2024