
- Start >
- Rivers >
- Waterlevel >
- Inn >
- Aschau >
- Chart of year

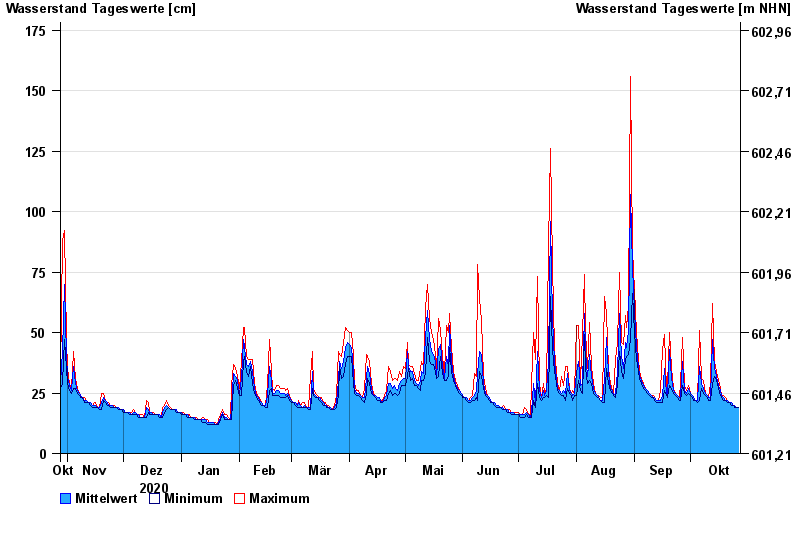
Chart of year Aschau / Prien
Waterlevel from 28.10.2020 to 27.10.2021
| Date | Mean value [cm] | Maximum [cm] | Minimum [cm] |
|---|---|---|---|
| 27.10.2021 | 19 | 19 | 19 |
| 26.10.2021 | 19 | 19 | 19 |
| 25.10.2021 | 20 | 20 | 19 |
| 24.10.2021 | 20 | 20 | 20 |
| 23.10.2021 | 21 | 21 | 20 |
| 22.10.2021 | 21 | 21 | 21 |
| 21.10.2021 | 22 | 22 | 21 |
© Bayerisches Landesamt für Umwelt 2024