
- Start >
- Rivers >
- Waterlevel >
- Inn >
- Aschau >
- Chart of year

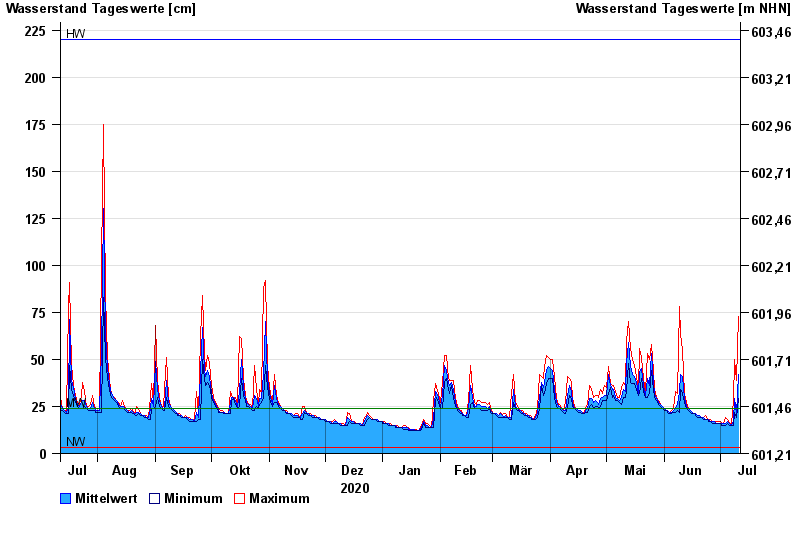
Chart of year Aschau / Prien
Waterlevel from 12.07.2020 to 11.07.2021
| Date | Mean value [cm] | Maximum [cm] | Minimum [cm] |
|---|---|---|---|
| 11.07.2021 | 42 | 73 | 29 |
| 10.07.2021 | 21 | 39 | 19 |
| 09.07.2021 | 29 | 50 | 22 |
| 08.07.2021 | 17 | 28 | 15 |
| 07.07.2021 | 15 | 16 | 15 |
| 06.07.2021 | 16 | 16 | 15 |
| 05.07.2021 | 17 | 18 | 16 |
© Bayerisches Landesamt für Umwelt 2024