
- Start >
- Rivers >
- Waterlevel >
- Iller - Lech - Bodensee >
- Türkheim >
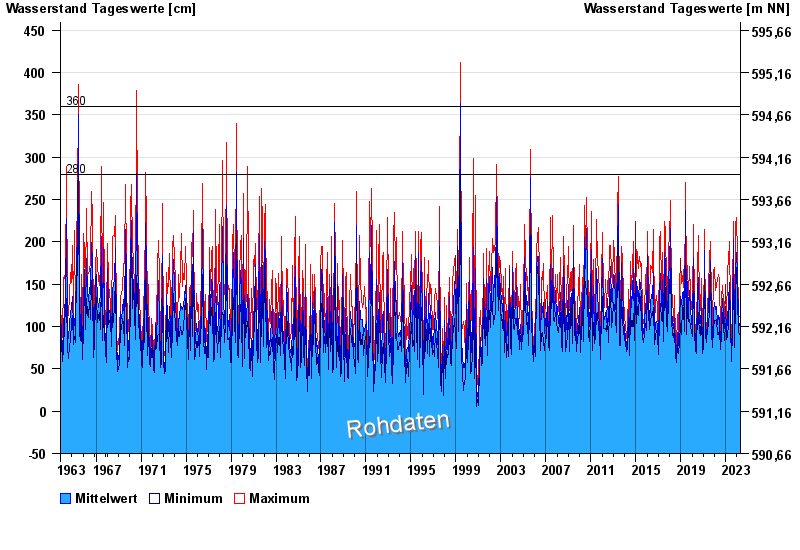
- Chart of total period

Chart of total period Türkheim / Wertach
Waterlevel from 01.11.1963 to 23.04.2024
note
Beeinflussung durch Kraftwerksbetrieb
- 360 cm: Türkheim: Ausuferungen oberhalb Türkheim links.
| Date | Mean value [cm] | Maximum [cm] | Minimum [cm] |
|---|---|---|---|
| 23.04.2024 | 88 | 92 | 85 |
| 22.04.2024 | 95 | 104 | 86 |
| 21.04.2024 | 93 | 98 | 90 |
| 20.04.2024 | 98 | 110 | 91 |
| 19.04.2024 | 90 | 97 | 85 |
| 18.04.2024 | 84 | 94 | 77 |
| 17.04.2024 | 72 | 92 | 60 |
© Bayerisches Landesamt für Umwelt 2024