
- Start >
- Rivers >
- Waterlevel >
- Iller - Lech - Bodensee >
- Trauchgau >
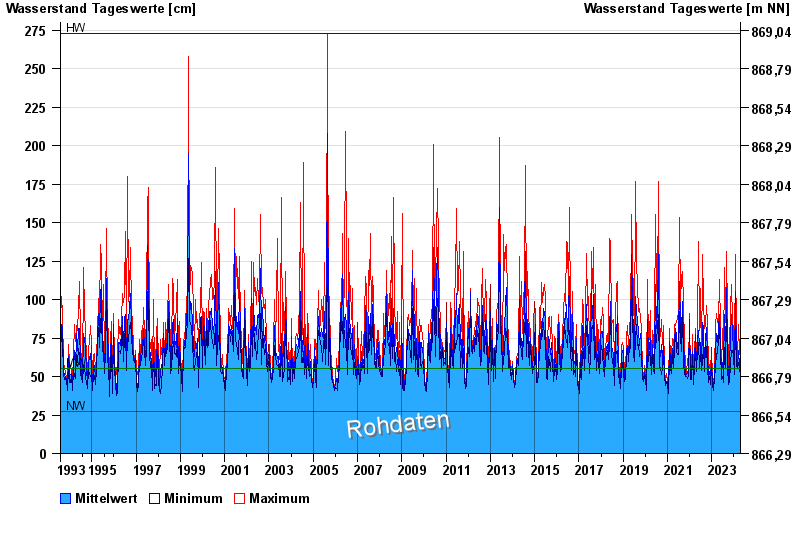
- Chart of total period

Chart of total period Trauchgau / Halblech
Waterlevel from 03.08.1993 to 19.04.2024
| Date | Mean value [cm] | Maximum [cm] | Minimum [cm] |
|---|---|---|---|
| 19.04.2024 | 51 | 53 | 49 |
| 18.04.2024 | 52 | 55 | 49 |
| 17.04.2024 | 54 | 55 | 49 |
| 16.04.2024 | 56 | 59 | 52 |
| 15.04.2024 | 55 | 63 | 50 |
| 14.04.2024 | 53 | 61 | 48 |
| 13.04.2024 | 51 | 54 | 47 |
© Bayerisches Landesamt für Umwelt 2024