
- Start >
- Rivers >
- Waterlevel >
- Iller - Lech - Bodensee >
- Stielings >
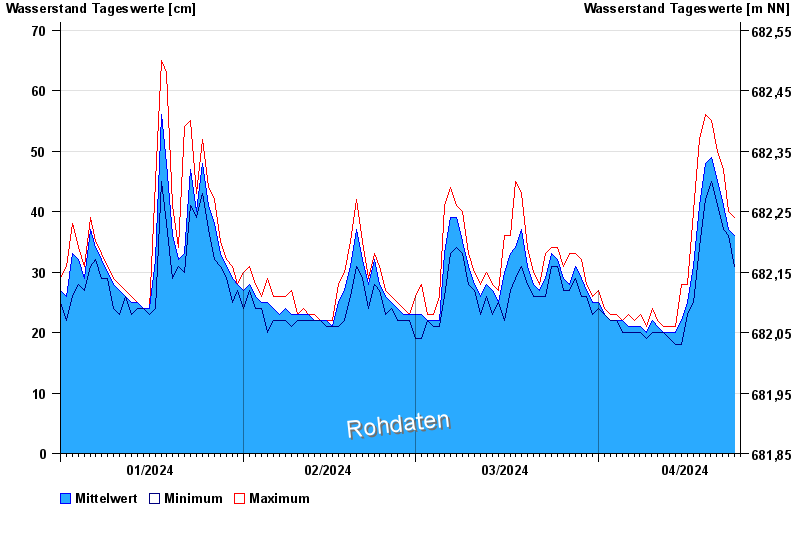
- Chart of year

Chart of year Stielings / Leubas
Waterlevel from 01.01.2024 to 24.04.2024
 Für diesen Pegel sind keine Hochwassermarken hinterlegt.
| Date | Mean value [cm] | Maximum [cm] | Minimum [cm] |
|---|---|---|---|
| 24.04.2024 | 35 | 37 | 33 |
| 23.04.2024 | 37 | 40 | 36 |
| 22.04.2024 | 41 | 47 | 37 |
| 21.04.2024 | 45 | 50 | 41 |
| 20.04.2024 | 49 | 55 | 45 |
| 19.04.2024 | 48 | 56 | 42 |
| 18.04.2024 | 41 | 52 | 34 |
© Bayerisches Landesamt für Umwelt 2024