
- Start >
- Rivers >
- Waterlevel >
- Iller - Lech - Bodensee >
- Roth >
- Chart of total period

Chart of total period Roth / Roth
Waterlevel from 01.11.1978 to 24.04.2024
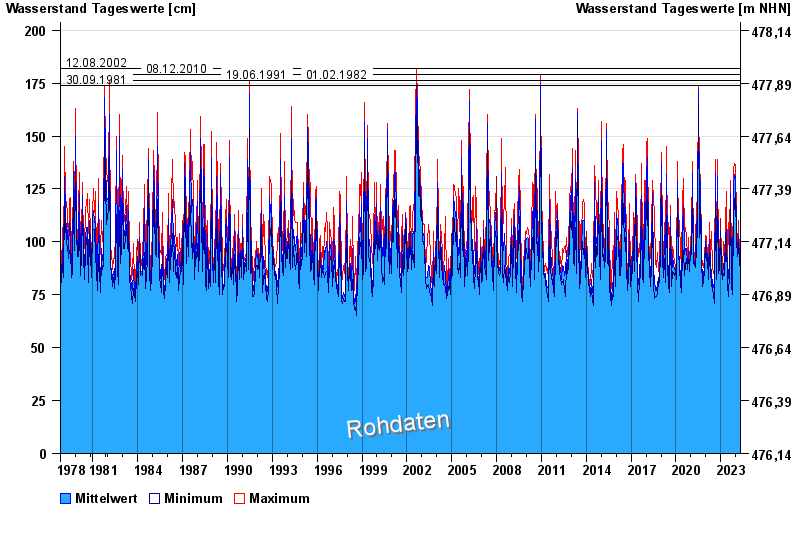
- 12.08.2002 Wasserstand: 182 cm
- 08.12.2010 Wasserstand: 179 cm
- 19.06.1991 Wasserstand: 176 cm
- 01.02.1982 Wasserstand: 176 cm
- 30.09.1981 Wasserstand: 174 cm
| Date | Mean value [cm] | Maximum [cm] | Minimum [cm] |
|---|---|---|---|
| 24.04.2024 | 85 | 86 | 84 |
| 23.04.2024 | 87 | 88 | 85 |
| 22.04.2024 | 89 | 90 | 88 |
| 21.04.2024 | 90 | 92 | 89 |
| 20.04.2024 | 93 | 95 | 90 |
| 19.04.2024 | 87 | 91 | 85 |
| 18.04.2024 | 85 | 86 | 84 |
© Bayerisches Landesamt für Umwelt 2024