
- Start >
- Rivers >
- Waterlevel >
- Iller - Lech - Bodensee >
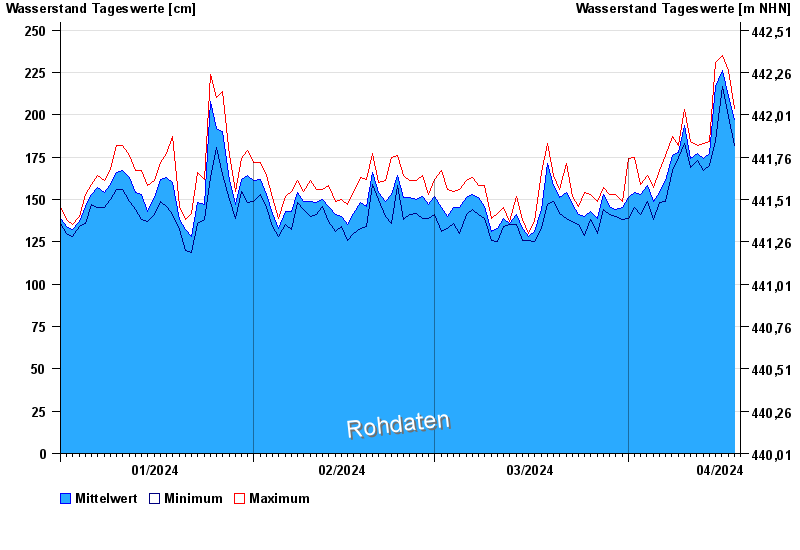
- Rosenheim o.d. Mangfallmündung >
- Chart of year

Chart of year Rosenheim o.d. Mangfallmündung / Inn
Waterlevel from 01.01.2024 to 18.04.2024
- 23.08.2005 Wasserstand: 568 cm
- 07.08.1985 Wasserstand: 551 cm
- 21.05.1999 Wasserstand: 522 cm
- 02.06.2013 Wasserstand: 511 cm
- 20.07.1981 Wasserstand: 493 cm
| Date | Mean value [cm] | Maximum [cm] | Minimum [cm] |
|---|---|---|---|
| 18.04.2024 | 201 | 204 | 199 |
| 17.04.2024 | 211 | 226 | 199 |
| 16.04.2024 | 226 | 235 | 217 |
| 15.04.2024 | 217 | 231 | 185 |
| 14.04.2024 | 177 | 184 | 170 |
| 13.04.2024 | 174 | 183 | 167 |
| 12.04.2024 | 177 | 182 | 173 |
© Bayerisches Landesamt für Umwelt 2024