
- Start >
- Rivers >
- Waterlevel >
- Iller - Lech - Bodensee >
- Rosenheim o.d. Mangfallmündung >
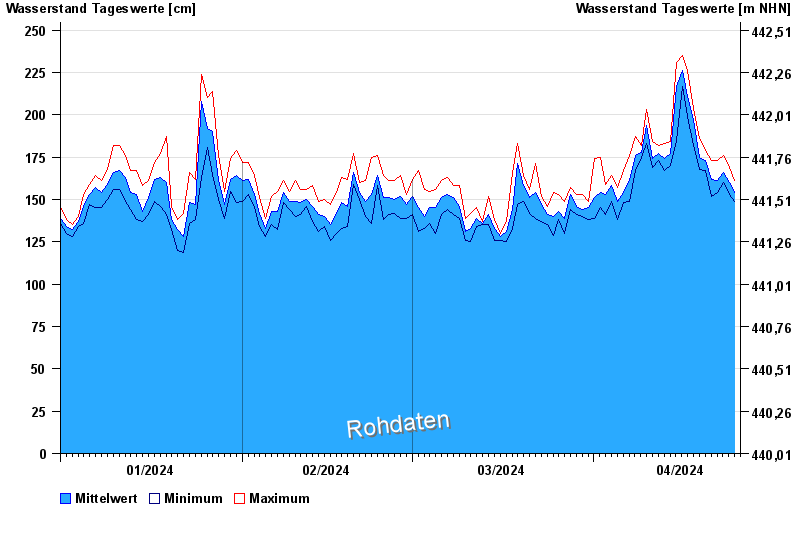
- Chart of year

Chart of year Rosenheim o.d. Mangfallmündung / Inn
Waterlevel from 01.01.2024 to 25.04.2024
- 23.08.2005 Wasserstand: 568 cm
- 07.08.1985 Wasserstand: 551 cm
- 21.05.1999 Wasserstand: 522 cm
- 02.06.2013 Wasserstand: 511 cm
- 20.07.1981 Wasserstand: 493 cm
| Date | Mean value [cm] | Maximum [cm] | Minimum [cm] |
|---|---|---|---|
| 25.04.2024 | 154 | 161 | 149 |
| 24.04.2024 | 160 | 169 | 153 |
| 23.04.2024 | 166 | 176 | 160 |
| 22.04.2024 | 161 | 173 | 154 |
| 21.04.2024 | 162 | 173 | 152 |
| 20.04.2024 | 173 | 179 | 167 |
| 19.04.2024 | 175 | 186 | 168 |
© Bayerisches Landesamt für Umwelt 2024