
- Start >
- Rivers >
- Waterlevel >
- Iller - Lech - Bodensee >
- Reckenberg >
- Chart of total period

Chart of total period Reckenberg / Ostrach
Waterlevel from 01.11.1972 to 19.04.2024
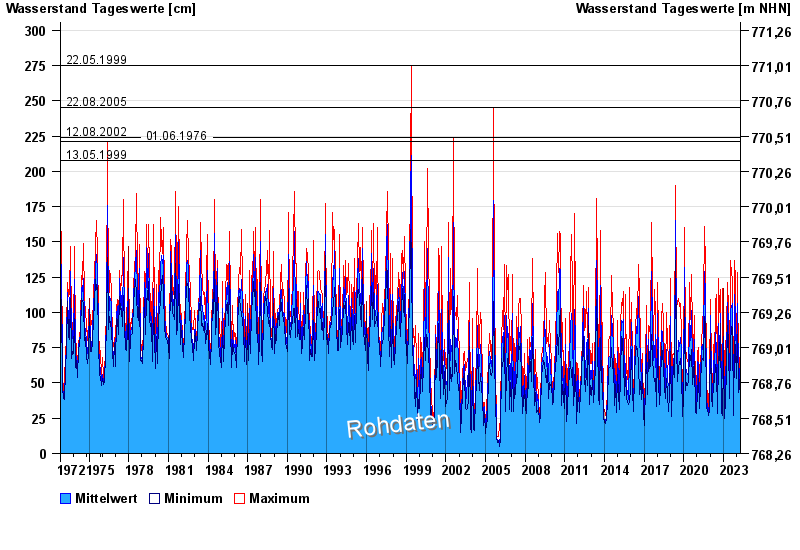
- 22.05.1999 Wasserstand: 275 cm
- 22.08.2005 Wasserstand: 245 cm
- 12.08.2002 Wasserstand: 224 cm
- 01.06.1976 Wasserstand: 221 cm
- 13.05.1999 Wasserstand: 208 cm
| Date | Mean value [cm] | Maximum [cm] | Minimum [cm] |
|---|---|---|---|
| 19.04.2024 | 40 | 44 | 39 |
| 18.04.2024 | 43 | 45 | 41 |
| 17.04.2024 | 50 | 55 | 45 |
| 16.04.2024 | 65 | 75 | 55 |
| 15.04.2024 | 65 | 74 | 59 |
| 14.04.2024 | 56 | 66 | 50 |
| 13.04.2024 | 49 | 57 | 45 |
© Bayerisches Landesamt für Umwelt 2024