
- Start >
- Rivers >
- Waterlevel >
- Iller - Lech - Bodensee >
- Landsberg >
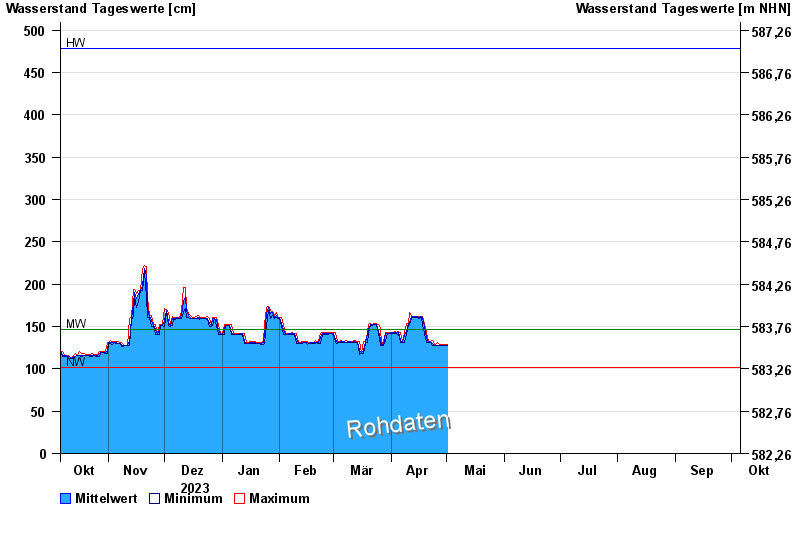
- Chart of year

Chart of year Landsberg / Lech
Waterlevel from 06.10.2023 to 05.10.2024
note
Messwerte beeinflusst durch Kraftwerkssteuerungen.
| Date | Mean value [cm] | Maximum [cm] | Minimum [cm] |
|---|---|---|---|
| 18.04.2024 | 162 | 162 | 161 |
| 17.04.2024 | 162 | 162 | 161 |
| 16.04.2024 | 161 | 162 | 160 |
| 15.04.2024 | 162 | 162 | 161 |
| 14.04.2024 | 162 | 162 | 161 |
| 13.04.2024 | 162 | 162 | 161 |
| 12.04.2024 | 162 | 163 | 160 |
© Bayerisches Landesamt für Umwelt 2024