
- Start >
- Rivers >
- Waterlevel >
- Iller - Lech - Bodensee >
- Landsberg >
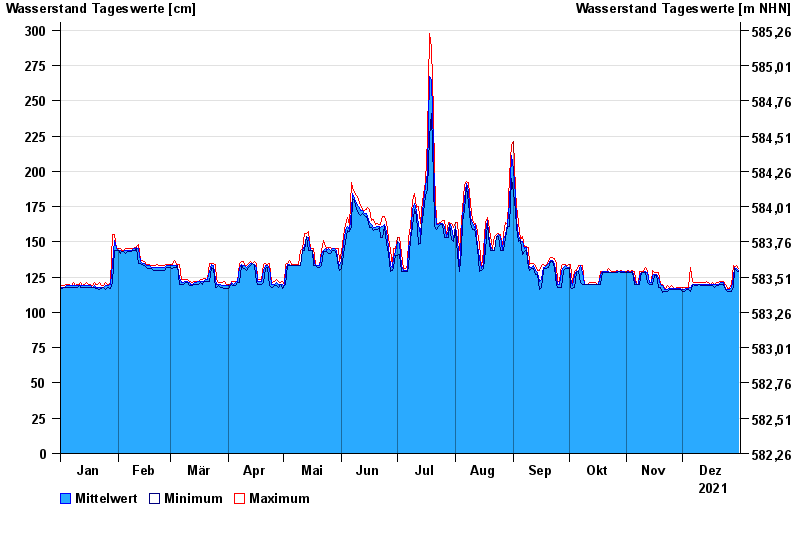
- Chart of year

Chart of year Landsberg / Lech
Waterlevel from 01.01.2021 to 31.12.2021
note
Messwerte beeinflusst durch Kraftwerkssteuerungen.
- 10.08.1970 Wasserstand: 478 cm
- 22.05.1999 Wasserstand: 437 cm
- 23.08.2005 Wasserstand: 414 cm
- 24.07.1966 Wasserstand: 408 cm
- 11.06.1965 Wasserstand: 390 cm
| Date | Mean value [cm] | Maximum [cm] | Minimum [cm] |
|---|---|---|---|
| 31.12.2021 | 130 | 131 | 129 |
| 30.12.2021 | 131 | 133 | 130 |
| 29.12.2021 | 132 | 132 | 131 |
| 28.12.2021 | 125 | 133 | 118 |
| 27.12.2021 | 118 | 120 | 115 |
| 26.12.2021 | 116 | 117 | 115 |
| 25.12.2021 | 116 | 117 | 115 |
© Bayerisches Landesamt für Umwelt 2024