
- Start >
- Rivers >
- Waterlevel >
- Iller - Lech - Bodensee >
- Landsberg >
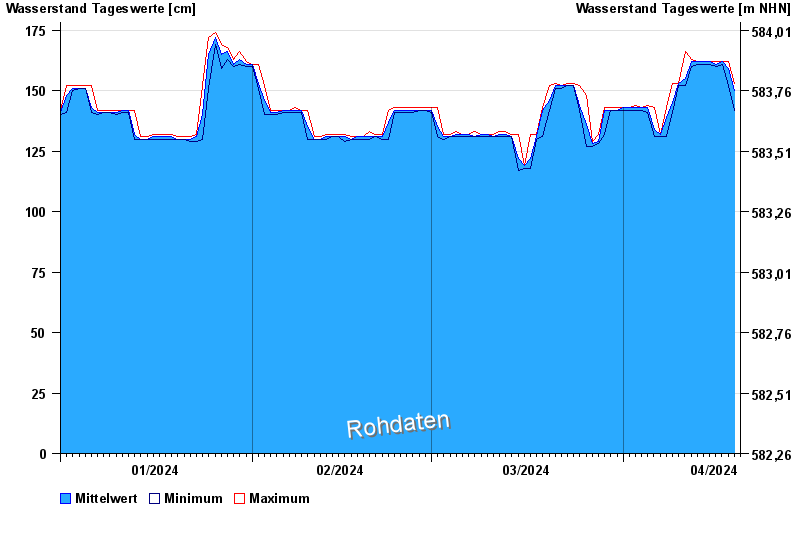
- Chart of year

Chart of year Landsberg / Lech
Waterlevel from 01.01.2024 to 19.04.2024
note
Messwerte beeinflusst durch Kraftwerkssteuerungen.
- 10.08.1970 Wasserstand: 478 cm
- 22.05.1999 Wasserstand: 437 cm
- 23.08.2005 Wasserstand: 414 cm
- 24.07.1966 Wasserstand: 408 cm
- 11.06.1965 Wasserstand: 390 cm
| Date | Mean value [cm] | Maximum [cm] | Minimum [cm] |
|---|---|---|---|
| 19.04.2024 | 151 | 153 | 142 |
| 18.04.2024 | 159 | 162 | 152 |
| 17.04.2024 | 162 | 162 | 161 |
| 16.04.2024 | 161 | 162 | 160 |
| 15.04.2024 | 162 | 162 | 161 |
| 14.04.2024 | 162 | 162 | 161 |
| 13.04.2024 | 162 | 162 | 161 |
© Bayerisches Landesamt für Umwelt 2024