
- Start >
- Rivers >
- Waterlevel >
- Iller - Lech - Bodensee >
- Landsberg >
- Chart of month

Chart of month Landsberg / Lech
Waterlevel from 25.07.2021 to 24.08.2021
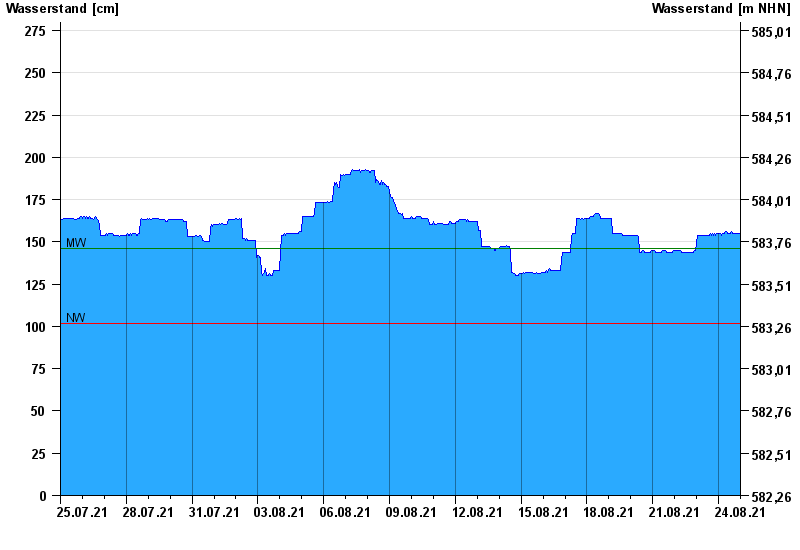
note
Messwerte beeinflusst durch Kraftwerkssteuerungen.
| Date | Waterlevel [cm] |
|---|---|
| 25.08.2021 00:45 | 155 |
| 25.08.2021 00:30 | 155 |
| 25.08.2021 00:15 | 154 |
| 25.08.2021 00:00 | 154 |
| 24.08.2021 23:45 | 155 |
| 24.08.2021 23:30 | 154 |
| 24.08.2021 23:15 | 154 |
© Bayerisches Landesamt für Umwelt 2024