
- Start >
- Rivers >
- Waterlevel >
- Iller - Lech - Bodensee >
- Hörmanshofen >
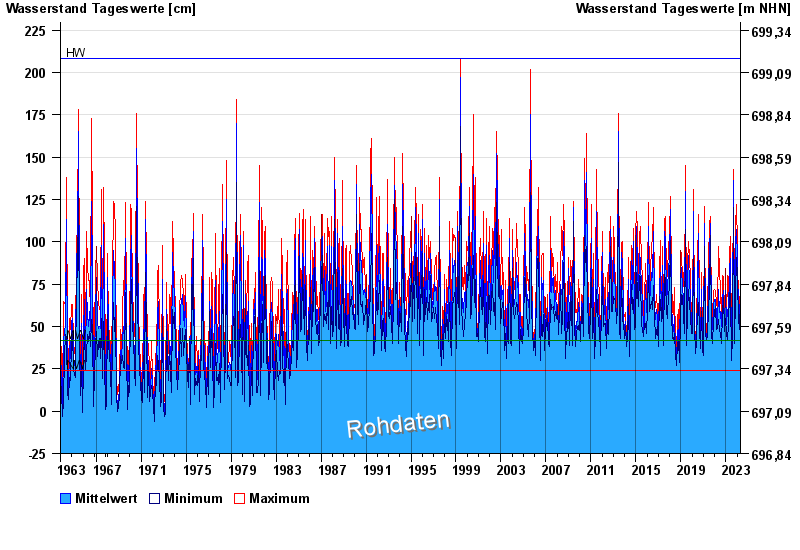
- Chart of total period

Chart of total period Hörmanshofen / Geltnach
Waterlevel from 01.11.1963 to 18.04.2024
| Date | Mean value [cm] | Maximum [cm] | Minimum [cm] |
|---|---|---|---|
| 18.04.2024 | 41 | 43 | 40 |
| 17.04.2024 | 36 | 42 | 33 |
| 16.04.2024 | 34 | 37 | 29 |
| 15.04.2024 | 33 | 38 | 29 |
| 14.04.2024 | 31 | 33 | 30 |
| 13.04.2024 | 32 | 33 | 29 |
| 12.04.2024 | 32 | 34 | 31 |
© Bayerisches Landesamt für Umwelt 2024