
- Start >
- Rivers >
- Waterlevel >
- Iller - Lech - Bodensee >
- Fallmühle >
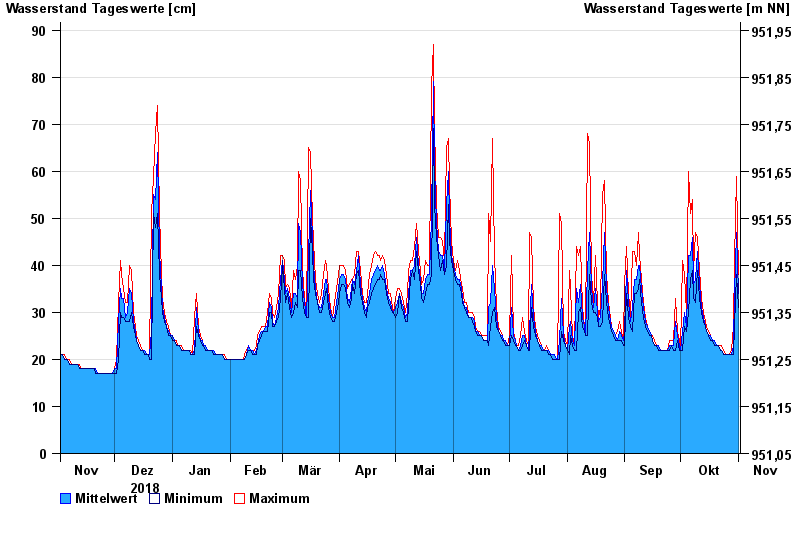
- Chart of year

Chart of year Fallmühle / Steinacher Achen
Waterlevel from 02.11.2018 to 01.11.2019
| Date | Mean value [cm] | Maximum [cm] | Minimum [cm] |
|---|---|---|---|
| 01.11.2019 | 34 | 38 | 31 |
| 31.10.2019 | 47 | 59 | 38 |
| 30.10.2019 | 34 | 41 | 27 |
| 29.10.2019 | 23 | 27 | 21 |
| 28.10.2019 | 21 | 22 | 21 |
| 27.10.2019 | 21 | 21 | 21 |
| 26.10.2019 | 21 | 21 | 21 |
© Bayerisches Landesamt für Umwelt 2024