
- Start >
- Rivers >
- Waterlevel >
- Iller - Lech - Bodensee >
- Fallmühle >
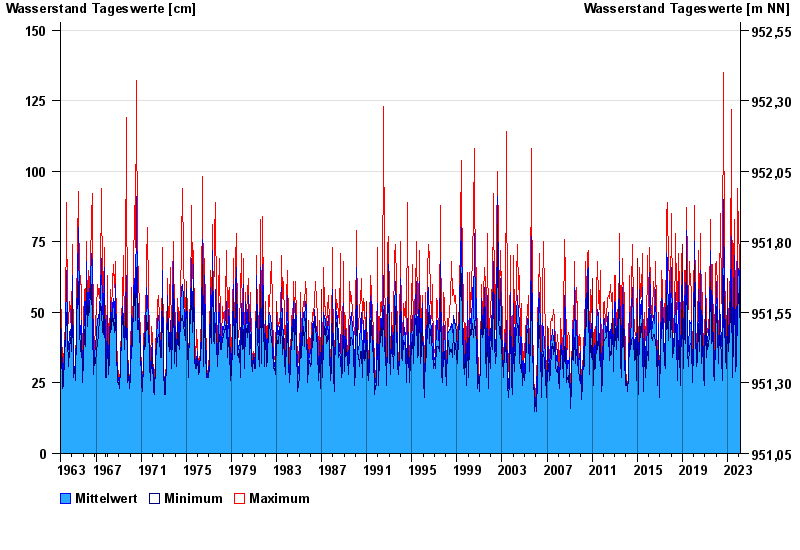
- Chart of total period

Chart of total period Fallmühle / Steinacher Achen
Waterlevel from 01.11.1963 to 01.03.2024
| Date | Mean value [cm] | Maximum [cm] | Minimum [cm] |
|---|---|---|---|
| 01.03.2024 | 28 | 28 | 28 |
| 29.02.2024 | 28 | 28 | 28 |
| 28.02.2024 | 28 | 29 | 28 |
| 27.02.2024 | 29 | 30 | 29 |
| 26.02.2024 | 30 | 31 | 30 |
| 25.02.2024 | 31 | 32 | 31 |
| 24.02.2024 | 33 | 35 | 32 |
© Bayerisches Landesamt für Umwelt 2024