
- Start >
- Rivers >
- Waterlevel >
- Iller - Lech - Bodensee >
- Eschach >
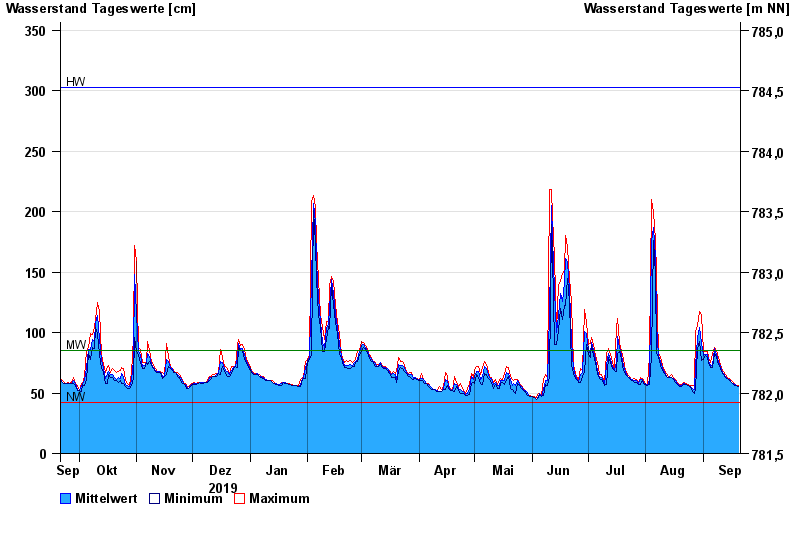
- Chart of year

Chart of year Eschach / Füssener Achen
Waterlevel from 21.09.2019 to 20.09.2020
| Date | Mean value [cm] | Maximum [cm] | Minimum [cm] |
|---|---|---|---|
| 20.09.2020 | 55 | 56 | 55 |
| 19.09.2020 | 56 | 56 | 56 |
| 18.09.2020 | 57 | 57 | 56 |
| 17.09.2020 | 58 | 59 | 57 |
| 16.09.2020 | 59 | 60 | 59 |
| 15.09.2020 | 61 | 62 | 60 |
| 14.09.2020 | 62 | 63 | 62 |
© Bayerisches Landesamt für Umwelt 2024