
- Start >
- Rivers >
- Waterlevel >
- Iller - Lech - Bodensee >
- Eschach >
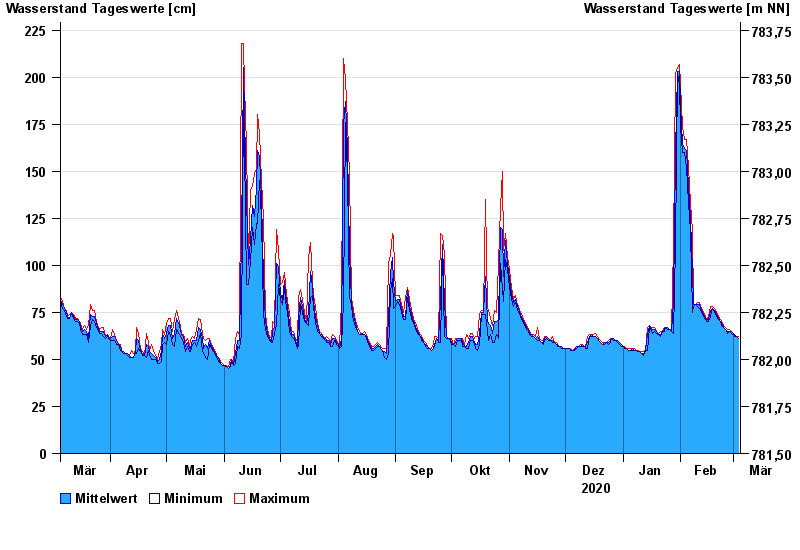
- Chart of year

Chart of year Eschach / Füssener Achen
Waterlevel from 05.03.2020 to 04.03.2021
- 22.05.1999 Wasserstand: 303 cm
- 23.08.2005 Wasserstand: 302 cm
- 18.06.1979 Wasserstand: 298 cm
- 27.01.1967 Wasserstand: 287 cm
- 10.08.1970 Wasserstand: 285 cm
| Date | Mean value [cm] | Maximum [cm] | Minimum [cm] |
|---|---|---|---|
| 04.03.2021 | 61 | 62 | 61 |
| 03.03.2021 | 62 | 62 | 62 |
| 02.03.2021 | 63 | 63 | 62 |
| 01.03.2021 | 64 | 64 | 63 |
| 28.02.2021 | 65 | 65 | 64 |
| 27.02.2021 | 65 | 66 | 65 |
| 26.02.2021 | 65 | 66 | 64 |
© Bayerisches Landesamt für Umwelt 2024