
- Start >
- Rivers >
- Waterlevel >
- Iller - Lech - Bodensee >
- Aeschach >
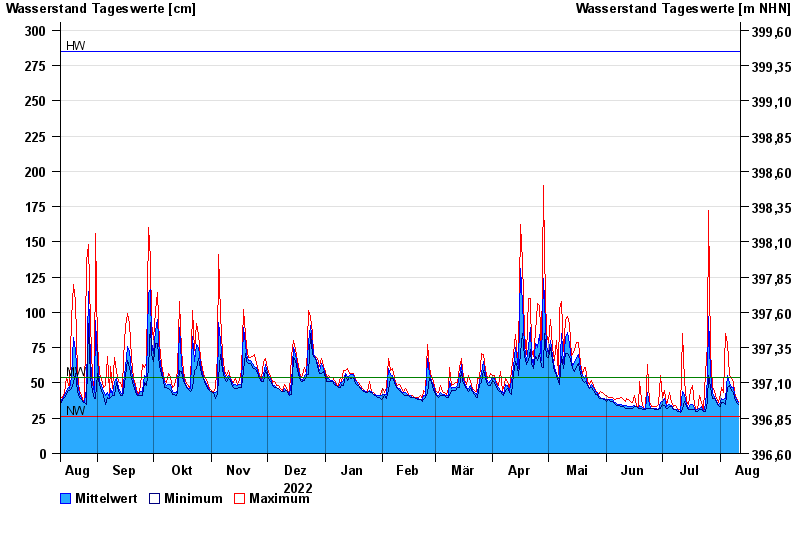
- Chart of year

Chart of year Aeschach / Oberreitnauer Ach
Waterlevel from 12.08.2022 to 11.08.2023
| Date | Mean value [cm] | Maximum [cm] | Minimum [cm] |
|---|---|---|---|
| 11.08.2023 | 36 | 37 | 35 |
| 10.08.2023 | 38 | 39 | 36 |
| 09.08.2023 | 41 | 43 | 39 |
| 08.08.2023 | 47 | 50 | 43 |
| 07.08.2023 | 47 | 54 | 45 |
| 06.08.2023 | 50 | 55 | 48 |
| 05.08.2023 | 55 | 78 | 47 |
© Bayerisches Landesamt für Umwelt 2024