
- Start >
- Rivers >
- Waterlevel >
- Oberer Main - Elbe >
- Weißdorf >
- Chart of total period

Chart of total period Weißdorf / Sächsische Saale
Waterlevel from 01.11.1982 to 25.04.2024
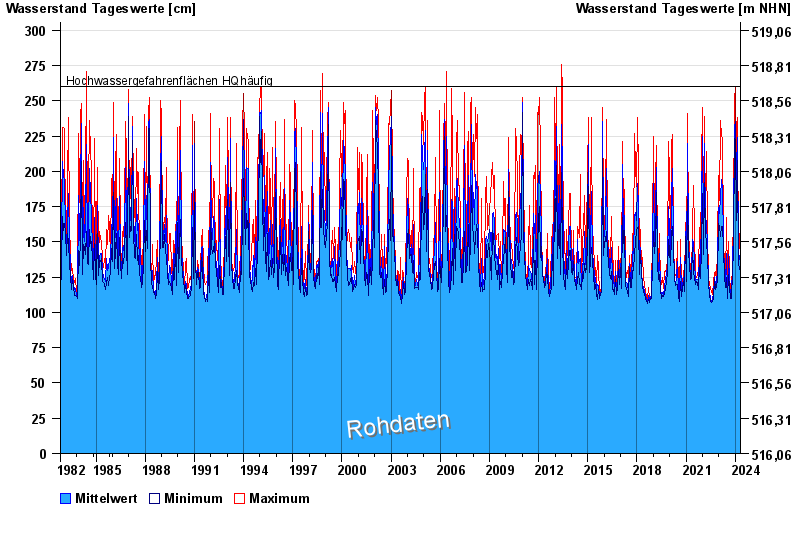
- Hochwassergefahrenfläche HQhäufig 260 cm
| Date | Mean value [cm] | Maximum [cm] | Minimum [cm] |
|---|---|---|---|
| 25.04.2024 | 127 | 127 | 127 |
| 24.04.2024 | 127 | 128 | 127 |
| 23.04.2024 | 130 | 133 | 128 |
| 22.04.2024 | 134 | 141 | 128 |
| 21.04.2024 | 129 | 141 | 123 |
| 20.04.2024 | 129 | 131 | 125 |
| 19.04.2024 | 119 | 129 | 115 |
© Bayerisches Landesamt für Umwelt 2024