
- Start >
- Rivers >
- Waterlevel >
- Oberer Main - Elbe >
- Weismain >
- Chart of total period

Chart of total period Weismain / Weismain
Waterlevel from 01.11.1963 to 19.04.2024
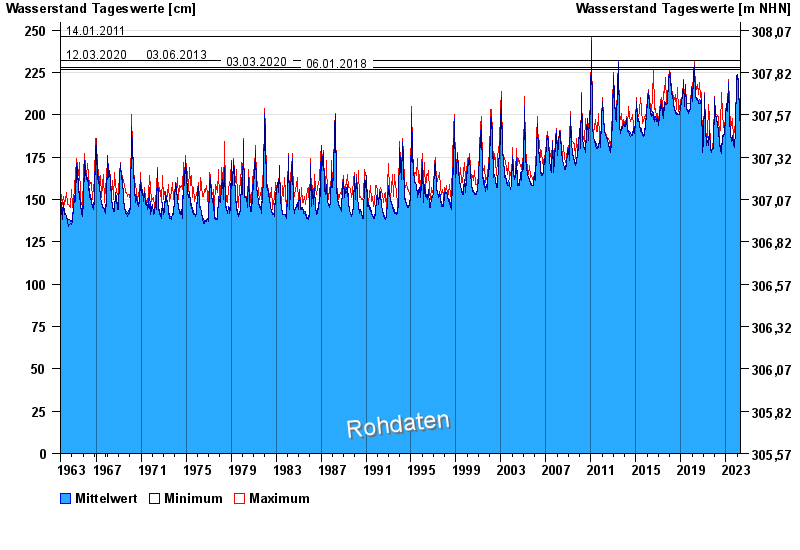
- 14.01.2011 Wasserstand: 246 cm
- 12.03.2020 Wasserstand: 232 cm
- 03.06.2013 Wasserstand: 232 cm
- 03.03.2020 Wasserstand: 228 cm
- 06.01.2018 Wasserstand: 227 cm
| Date | Mean value [cm] | Maximum [cm] | Minimum [cm] |
|---|---|---|---|
| 19.04.2024 | 193 | 195 | 192 |
| 18.04.2024 | 192 | 193 | 192 |
| 17.04.2024 | 193 | 195 | 188 |
| 16.04.2024 | 193 | 197 | 192 |
| 15.04.2024 | 192 | 194 | 191 |
| 14.04.2024 | 192 | 193 | 192 |
| 13.04.2024 | 193 | 193 | 192 |
© Bayerisches Landesamt für Umwelt 2024