
- Start >
- Rivers >
- Waterlevel >
- Oberer Main - Elbe >
- Unterlangenstadt >
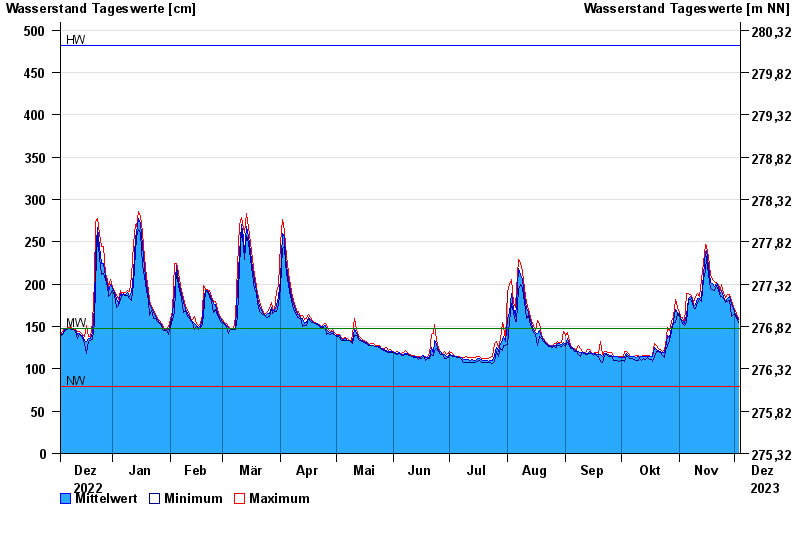
- Chart of year

Chart of year Unterlangenstadt / Rodach
Waterlevel from 04.12.2022 to 03.12.2023
| Date | Mean value [cm] | Maximum [cm] | Minimum [cm] |
|---|---|---|---|
| 03.12.2023 | 158 | 160 | 155 |
| 02.12.2023 | 162 | 165 | 160 |
| 01.12.2023 | 167 | 170 | 164 |
| 30.11.2023 | 171 | 174 | 164 |
| 29.11.2023 | 176 | 181 | 162 |
| 28.11.2023 | 185 | 188 | 181 |
| 27.11.2023 | 183 | 188 | 179 |
© Bayerisches Landesamt für Umwelt 2024