
- Start >
- Rivers >
- Waterlevel >
- Oberer Main - Elbe >
- Unterlangenstadt >
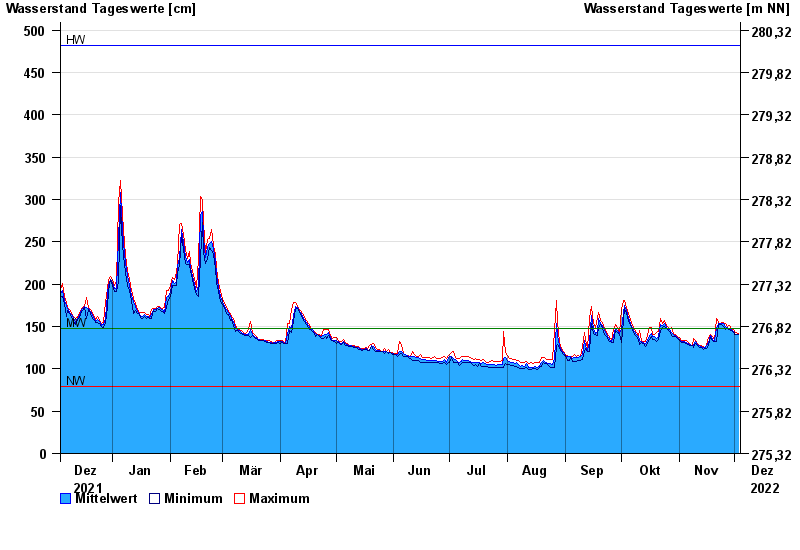
- Chart of year

Chart of year Unterlangenstadt / Rodach
Waterlevel from 04.12.2021 to 03.12.2022
| Date | Mean value [cm] | Maximum [cm] | Minimum [cm] |
|---|---|---|---|
| 03.12.2022 | 140 | 142 | 140 |
| 02.12.2022 | 141 | 143 | 140 |
| 01.12.2022 | 142 | 144 | 141 |
| 30.11.2022 | 144 | 146 | 143 |
| 29.11.2022 | 146 | 148 | 145 |
| 28.11.2022 | 148 | 151 | 146 |
| 27.11.2022 | 149 | 150 | 148 |
© Bayerisches Landesamt für Umwelt 2024