
- Start >
- Rivers >
- Waterlevel >
- Oberer Main - Elbe >
- Unterlangenstadt >
- Chart of year

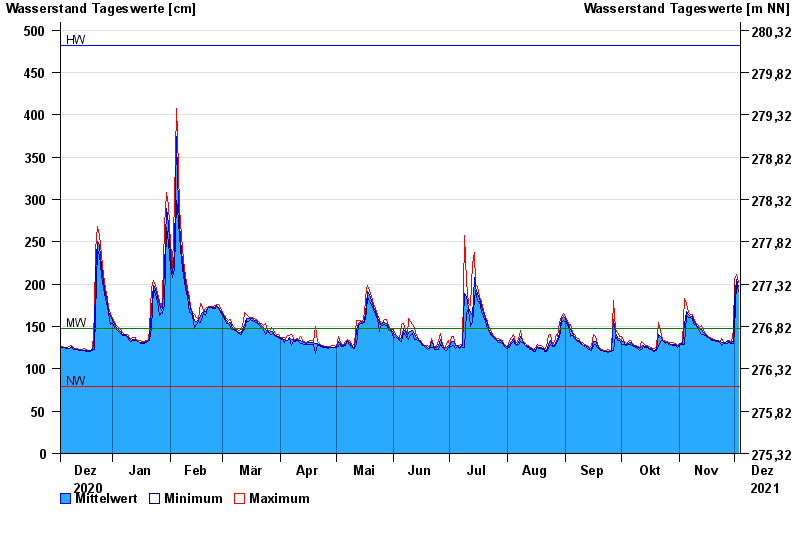
Chart of year Unterlangenstadt / Rodach
Waterlevel from 04.12.2020 to 03.12.2021
| Date | Mean value [cm] | Maximum [cm] | Minimum [cm] |
|---|---|---|---|
| 03.12.2021 | 197 | 202 | 191 |
| 02.12.2021 | 206 | 211 | 202 |
| 01.12.2021 | 181 | 205 | 145 |
| 30.11.2021 | 133 | 145 | 130 |
| 29.11.2021 | 131 | 132 | 130 |
| 28.11.2021 | 132 | 134 | 131 |
| 27.11.2021 | 132 | 134 | 130 |
© Bayerisches Landesamt für Umwelt 2024