
- Start >
- Rivers >
- Waterlevel >
- Oberer Main - Elbe >
- Unterlangenstadt >
- Chart of year

Chart of year Unterlangenstadt / Rodach
Waterlevel from 01.01.2020 to 31.12.2020
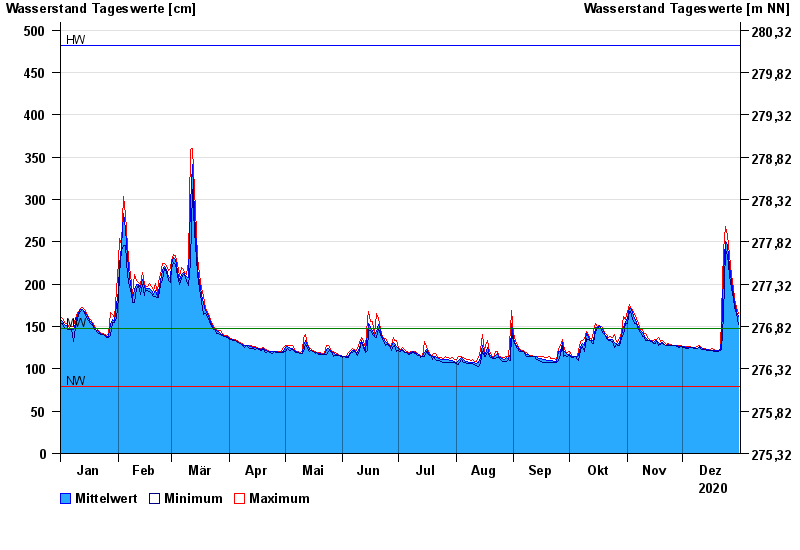
| Date | Mean value [cm] | Maximum [cm] | Minimum [cm] |
|---|---|---|---|
| 31.12.2020 | 162 | 165 | 152 |
| 30.12.2020 | 168 | 173 | 165 |
| 29.12.2020 | 178 | 183 | 173 |
| 28.12.2020 | 188 | 195 | 183 |
| 27.12.2020 | 202 | 211 | 195 |
| 26.12.2020 | 221 | 234 | 210 |
| 25.12.2020 | 246 | 258 | 234 |
© Bayerisches Landesamt für Umwelt 2024