
- Start >
- Rivers >
- Waterlevel >
- Oberer Main - Elbe >
- Unterlangenstadt >
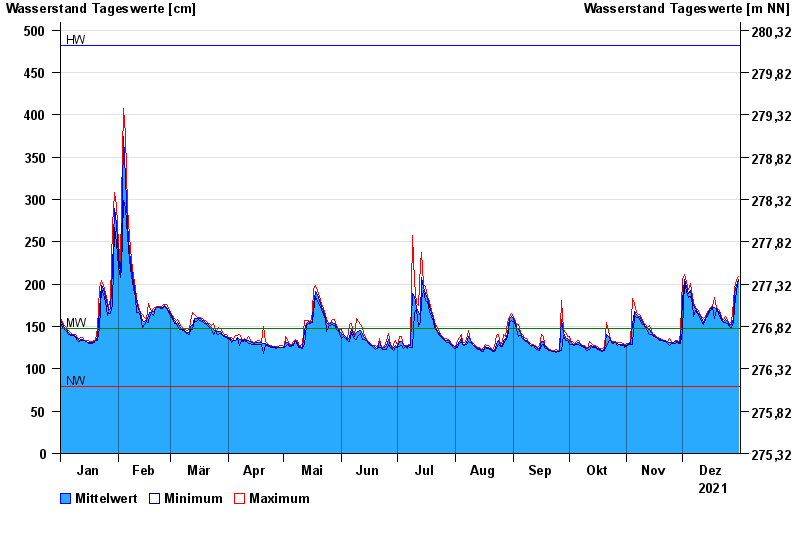
- Chart of year

Chart of year Unterlangenstadt / Rodach
Waterlevel from 01.01.2021 to 31.12.2021
| Date | Mean value [cm] | Maximum [cm] | Minimum [cm] |
|---|---|---|---|
| 31.12.2021 | 206 | 209 | 205 |
| 30.12.2021 | 199 | 206 | 191 |
| 29.12.2021 | 189 | 195 | 172 |
| 28.12.2021 | 159 | 178 | 154 |
| 27.12.2021 | 152 | 155 | 149 |
| 26.12.2021 | 151 | 154 | 150 |
| 25.12.2021 | 156 | 157 | 154 |
© Bayerisches Landesamt für Umwelt 2024