
- Start >
- Rivers >
- Waterlevel >
- Oberer Main - Elbe >
- Unterlangenstadt >
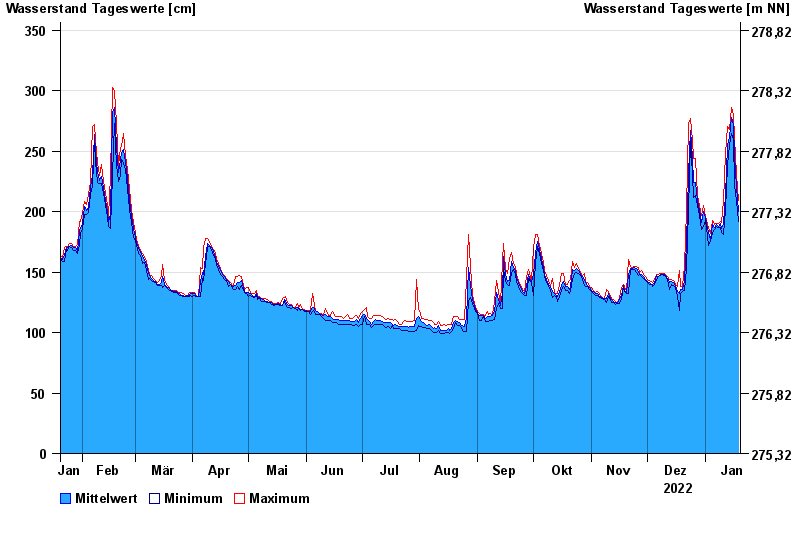
- Chart of year

Chart of year Unterlangenstadt / Rodach
Waterlevel from 20.01.2022 to 19.01.2023
- 28.01.1901 Wasserstand: 522 cm
- 02.03.1901 Wasserstand: 490 cm
- 24.12.1967 Wasserstand: 482 cm
- 06.04.1901 Wasserstand: 482 cm
- 09.02.1946 Wasserstand: 477 cm
| Date | Mean value [cm] | Maximum [cm] | Minimum [cm] |
|---|---|---|---|
| 19.01.2023 | 200 | 209 | 192 |
| 18.01.2023 | 220 | 231 | 209 |
| 17.01.2023 | 246 | 261 | 222 |
| 16.01.2023 | 272 | 280 | 260 |
| 15.01.2023 | 278 | 286 | 265 |
| 14.01.2023 | 261 | 268 | 255 |
| 13.01.2023 | 255 | 270 | 238 |
© Bayerisches Landesamt für Umwelt 2024