
- Start >
- Rivers >
- Waterlevel >
- Oberer Main - Elbe >
- Unterbruck Flutmulde >
- Chart of year

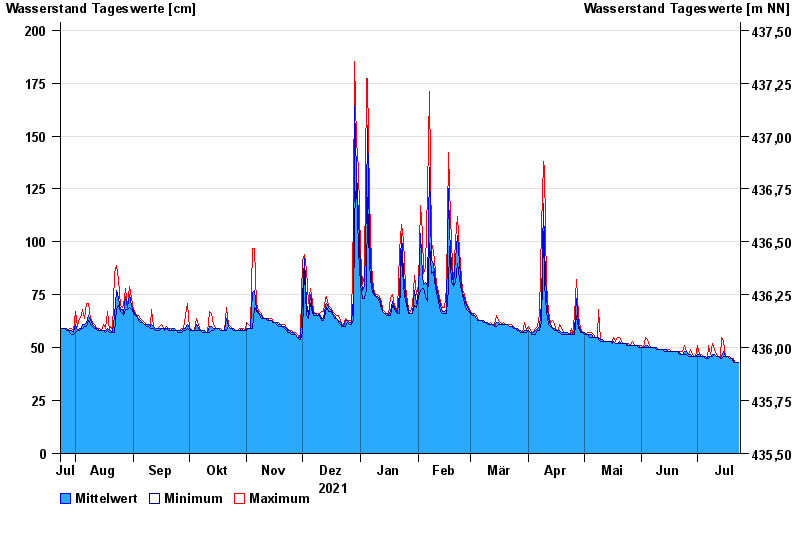
Chart of year Unterbruck Flutmulde / Haidenaab
Waterlevel from 24.07.2021 to 23.07.2022
| Date | Mean value [cm] | Maximum [cm] | Minimum [cm] |
|---|---|---|---|
| 23.07.2022 | 43 | 43 | 43 |
| 22.07.2022 | 43 | 43 | 43 |
| 21.07.2022 | 43 | 43 | 43 |
| 20.07.2022 | 44 | 45 | 43 |
| 19.07.2022 | 45 | 45 | 45 |
| 18.07.2022 | 45 | 46 | 45 |
| 17.07.2022 | 46 | 46 | 46 |
© Bayerisches Landesamt für Umwelt 2024