
- Start >
- Rivers >
- Waterlevel >
- Oberer Main - Elbe >
- Unterbruck Flutmulde >
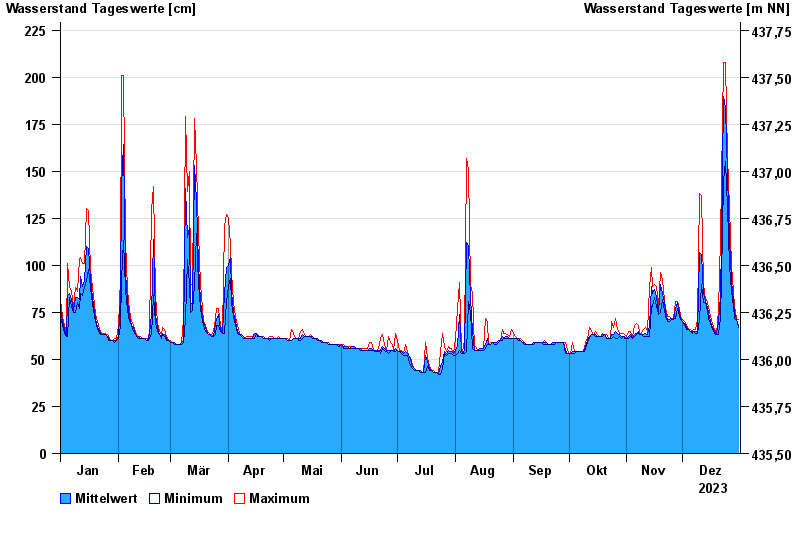
- Chart of year

Chart of year Unterbruck Flutmulde / Haidenaab
Waterlevel from 01.01.2023 to 31.12.2023
| Date | Mean value [cm] | Maximum [cm] | Minimum [cm] |
|---|---|---|---|
| 31.12.2023 | 68 | 71 | 67 |
| 30.12.2023 | 71 | 72 | 71 |
| 29.12.2023 | 75 | 78 | 72 |
| 28.12.2023 | 81 | 86 | 78 |
| 27.12.2023 | 92 | 100 | 86 |
| 26.12.2023 | 114 | 131 | 100 |
| 25.12.2023 | 148 | 158 | 131 |
© Bayerisches Landesamt für Umwelt 2024