
- Start >
- Rivers >
- Waterlevel >
- Oberer Main - Elbe >
- Unterbruck Flutmulde >
- Chart of year

Chart of year Unterbruck Flutmulde / Haidenaab
Waterlevel from 01.01.2022 to 31.12.2022
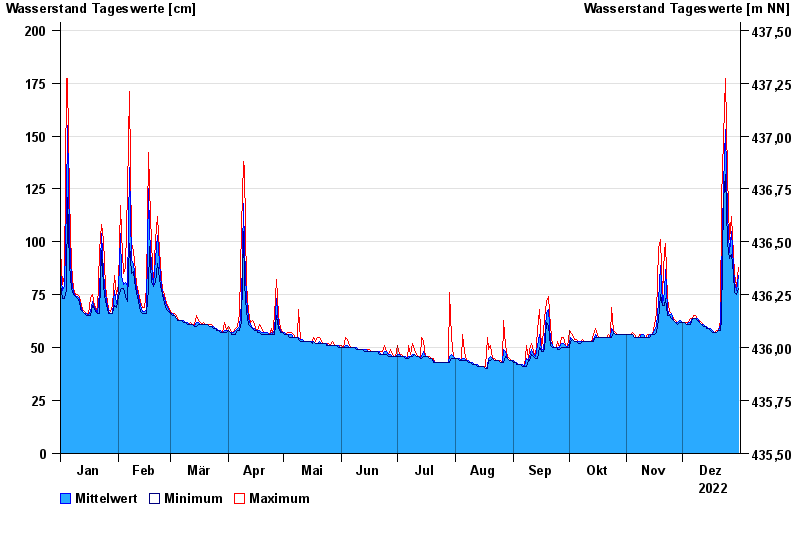
| Date | Mean value [cm] | Maximum [cm] | Minimum [cm] |
|---|---|---|---|
| 31.12.2022 | 84 | 88 | 78 |
| 30.12.2022 | 77 | 79 | 75 |
| 29.12.2022 | 81 | 85 | 76 |
| 28.12.2022 | 88 | 94 | 85 |
| 27.12.2022 | 105 | 112 | 94 |
| 26.12.2022 | 95 | 101 | 92 |
| 25.12.2022 | 113 | 132 | 99 |
© Bayerisches Landesamt für Umwelt 2024