
- Start >
- Rivers >
- Waterlevel >
- Oberer Main - Elbe >
- Schwürbitz >
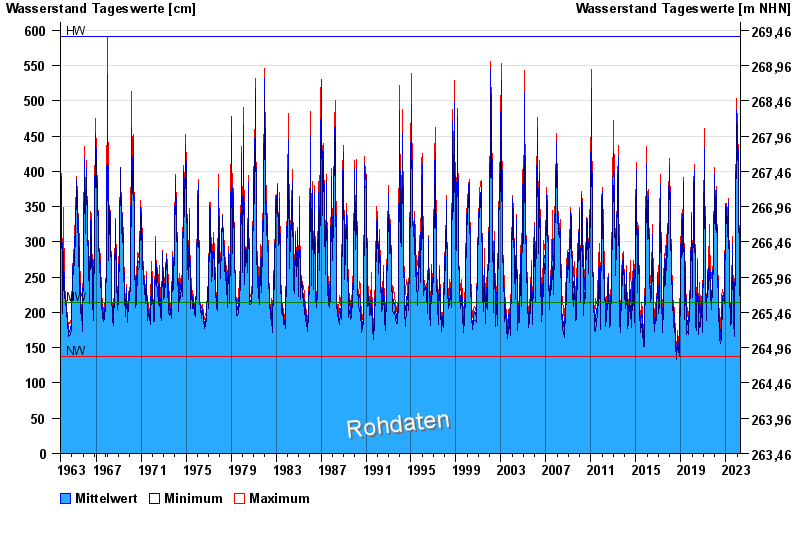
- Chart of total period

Chart of total period Schwürbitz / Main
Waterlevel from 01.11.1963 to 19.04.2024
| Date | Mean value [cm] | Maximum [cm] | Minimum [cm] |
|---|---|---|---|
| 19.04.2024 | 193 | 193 | 192 |
| 18.04.2024 | 195 | 198 | 192 |
| 17.04.2024 | 197 | 200 | 189 |
| 16.04.2024 | 185 | 188 | 182 |
| 15.04.2024 | 184 | 185 | 182 |
| 14.04.2024 | 186 | 187 | 185 |
| 13.04.2024 | 187 | 190 | 185 |
© Bayerisches Landesamt für Umwelt 2024