
- Start >
- Rivers >
- Waterlevel >
- Oberer Main - Elbe >
- Rieblich >
- Chart of year

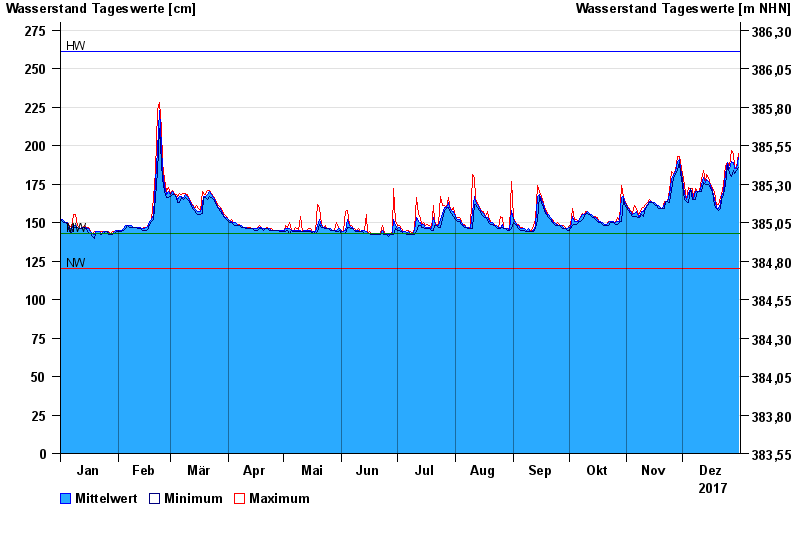
Chart of year Rieblich / Rodach
Waterlevel from 01.01.2017 to 31.12.2017
| Date | Mean value [cm] | Maximum [cm] | Minimum [cm] |
|---|---|---|---|
| 31.12.2017 | 192 | 195 | 186 |
| 30.12.2017 | 185 | 186 | 184 |
| 29.12.2017 | 185 | 186 | 182 |
| 28.12.2017 | 189 | 195 | 184 |
| 27.12.2017 | 190 | 197 | 180 |
| 26.12.2017 | 185 | 187 | 182 |
| 25.12.2017 | 189 | 189 | 187 |
© Bayerisches Landesamt für Umwelt 2024