
- Start >
- Rivers >
- Waterlevel >
- Oberer Main - Elbe >
- Pfarrweisach >
- Chart of year

Chart of year Pfarrweisach / Weisach
Waterlevel from 01.01.2024 to 19.04.2024
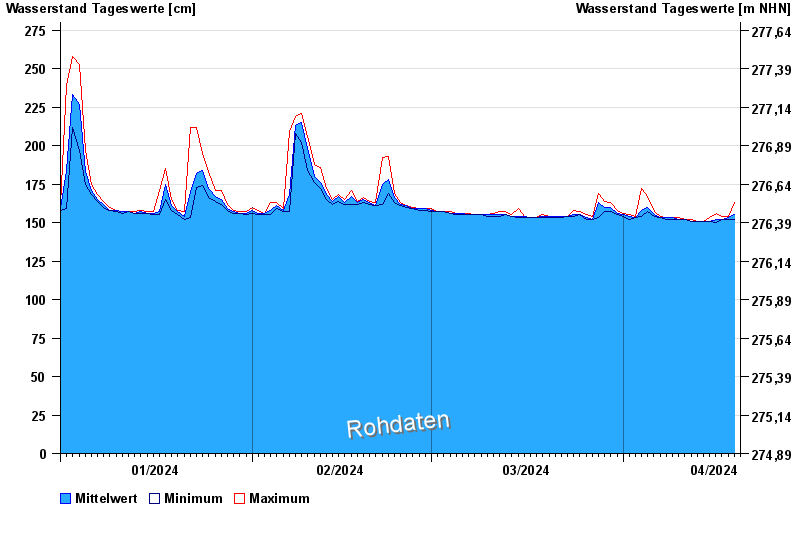
| Date | Mean value [cm] | Maximum [cm] | Minimum [cm] |
|---|---|---|---|
| 19.04.2024 | 153 | 156 | 152 |
| 18.04.2024 | 153 | 154 | 152 |
| 17.04.2024 | 152 | 154 | 152 |
| 16.04.2024 | 152 | 156 | 150 |
| 15.04.2024 | 151 | 153 | 151 |
| 14.04.2024 | 151 | 151 | 151 |
| 13.04.2024 | 151 | 151 | 151 |
© Bayerisches Landesamt für Umwelt 2024