
- Start >
- Rivers >
- Waterlevel >
- Oberer Main - Elbe >
- Oberlauter >
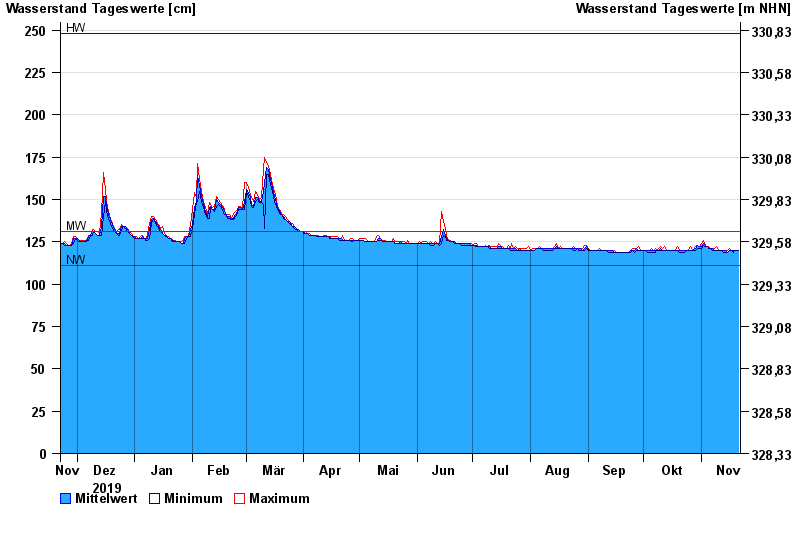
- Chart of year

Chart of year Oberlauter / Lauterbach
Waterlevel from 22.11.2019 to 21.11.2020
| Date | Mean value [cm] | Maximum [cm] | Minimum [cm] |
|---|---|---|---|
| 21.11.2020 | 120 | 120 | 120 |
| 20.11.2020 | 120 | 120 | 120 |
| 19.11.2020 | 120 | 120 | 120 |
| 18.11.2020 | 120 | 120 | 119 |
| 17.11.2020 | 120 | 120 | 120 |
| 16.11.2020 | 120 | 121 | 120 |
| 15.11.2020 | 119 | 120 | 119 |
© Bayerisches Landesamt für Umwelt 2024