
- Start >
- Rivers >
- Waterlevel >
- Oberer Main - Elbe >
- Oberlauter >
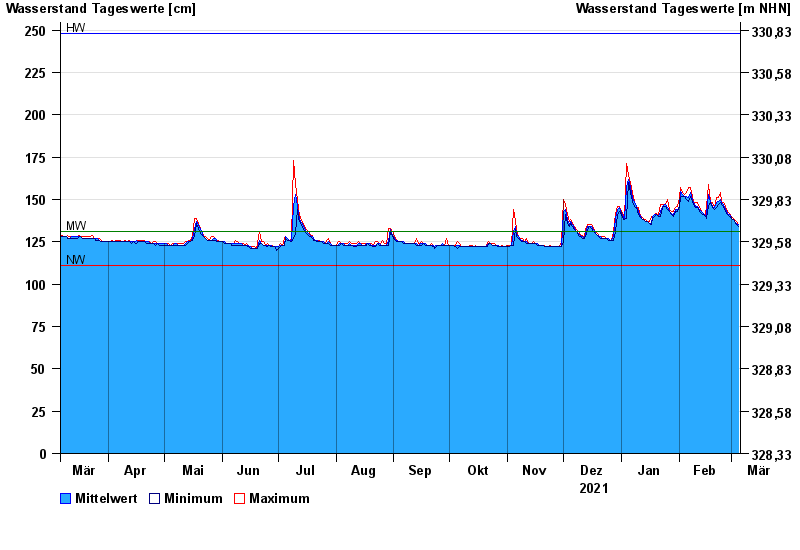
- Chart of year

Chart of year Oberlauter / Lauterbach
Waterlevel from 06.03.2021 to 05.03.2022
| Date | Mean value [cm] | Maximum [cm] | Minimum [cm] |
|---|---|---|---|
| 05.03.2022 | 135 | 135 | 134 |
| 04.03.2022 | 136 | 137 | 135 |
| 03.03.2022 | 137 | 138 | 137 |
| 02.03.2022 | 138 | 139 | 138 |
| 01.03.2022 | 139 | 140 | 139 |
| 28.02.2022 | 141 | 142 | 140 |
| 27.02.2022 | 142 | 143 | 141 |
© Bayerisches Landesamt für Umwelt 2024