
- Start >
- Rivers >
- Waterlevel >
- Oberer Main - Elbe >
- Oberhammer >
- Chart of total period

Chart of total period Oberhammer / Untere Steinach
Waterlevel from 01.11.1963 to 20.04.2024
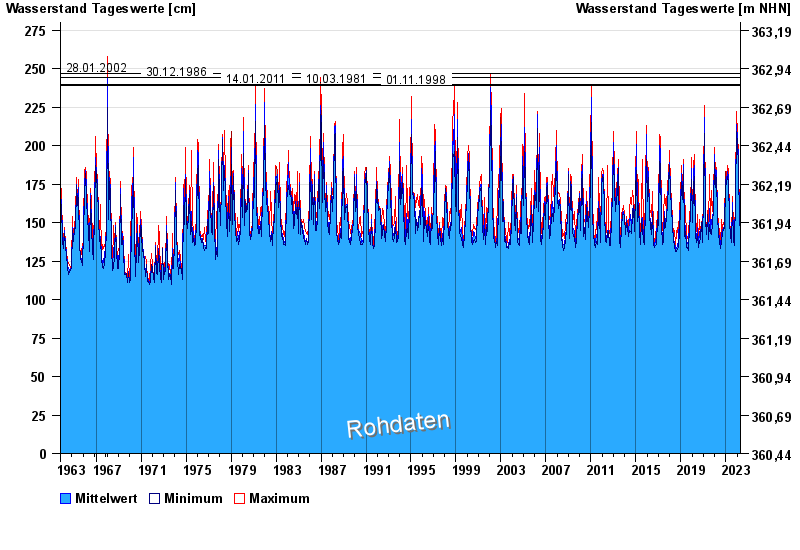
- 28.01.2002 Wasserstand: 247 cm
- 30.12.1986 Wasserstand: 244 cm
- 14.01.2011 Wasserstand: 240 cm
- 10.03.1981 Wasserstand: 240 cm
- 01.11.1998 Wasserstand: 239 cm
| Date | Mean value [cm] | Maximum [cm] | Minimum [cm] |
|---|---|---|---|
| 20.04.2024 | 148 | 148 | 148 |
| 19.04.2024 | 143 | 148 | 140 |
| 18.04.2024 | 140 | 141 | 140 |
| 17.04.2024 | 141 | 142 | 140 |
| 16.04.2024 | 141 | 143 | 140 |
| 15.04.2024 | 140 | 140 | 140 |
| 14.04.2024 | 140 | 141 | 140 |
© Bayerisches Landesamt für Umwelt 2024