
- Start >
- Rivers >
- Waterlevel >
- Oberer Main - Elbe >
- Muggendorf >
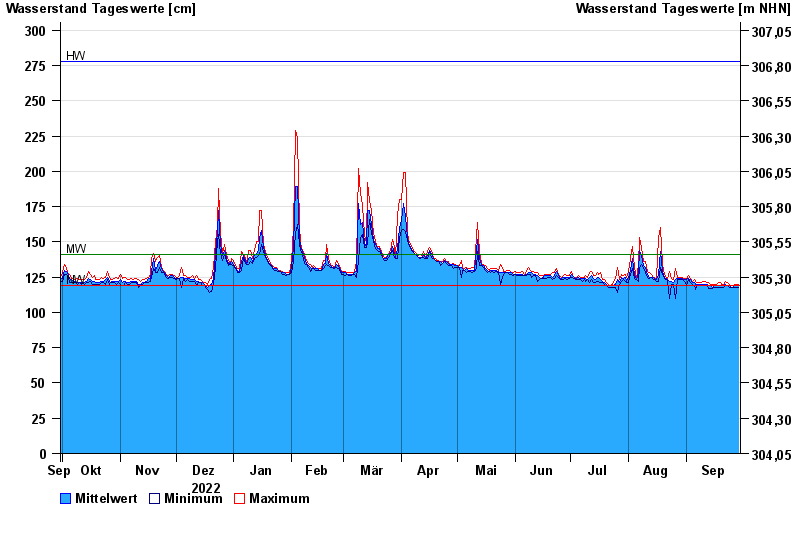
- Chart of year

Chart of year Muggendorf / Wiesent
Waterlevel from 30.09.2022 to 29.09.2023
| Date | Mean value [cm] | Maximum [cm] | Minimum [cm] |
|---|---|---|---|
| 29.09.2023 | 119 | 120 | 118 |
| 28.09.2023 | 119 | 120 | 118 |
| 27.09.2023 | 119 | 120 | 118 |
| 26.09.2023 | 118 | 119 | 118 |
| 25.09.2023 | 118 | 119 | 118 |
| 24.09.2023 | 119 | 120 | 118 |
| 23.09.2023 | 119 | 121 | 119 |
© Bayerisches Landesamt für Umwelt 2024