
- Start >
- Rivers >
- Waterlevel >
- Oberer Main - Elbe >
- Michelfeld >
- Chart of year

Chart of year Michelfeld / Pegnitz
Waterlevel from 28.01.2024 to 27.01.2025
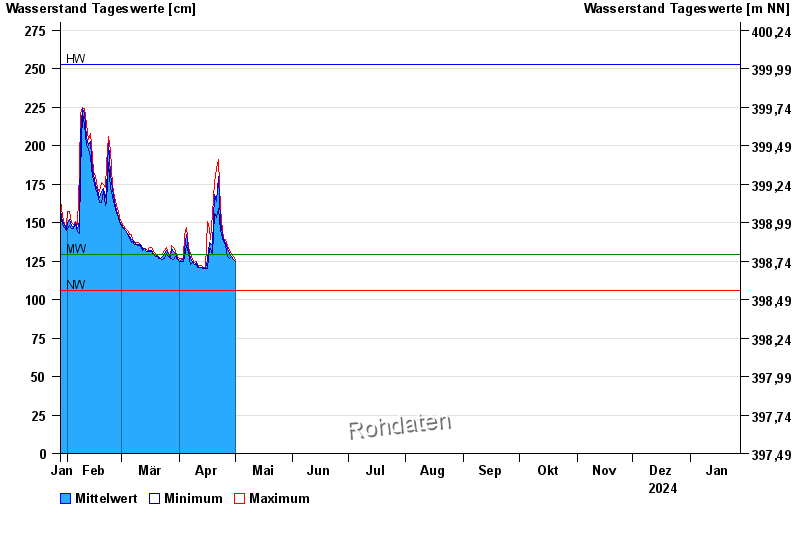
| Date | Mean value [cm] | Maximum [cm] | Minimum [cm] |
|---|---|---|---|
| 18.04.2024 | 136 | 139 | 133 |
| 17.04.2024 | 137 | 146 | 133 |
| 16.04.2024 | 126 | 151 | 120 |
| 15.04.2024 | 120 | 121 | 120 |
| 14.04.2024 | 121 | 121 | 120 |
| 13.04.2024 | 121 | 122 | 121 |
| 12.04.2024 | 121 | 122 | 121 |
© Bayerisches Landesamt für Umwelt 2024