
- Start >
- Rivers >
- Waterlevel >
- Oberer Main - Elbe >
- Laufermühle >
- Chart of year

Chart of year Laufermühle / Aisch
Waterlevel from 19.09.2020 to 18.09.2021
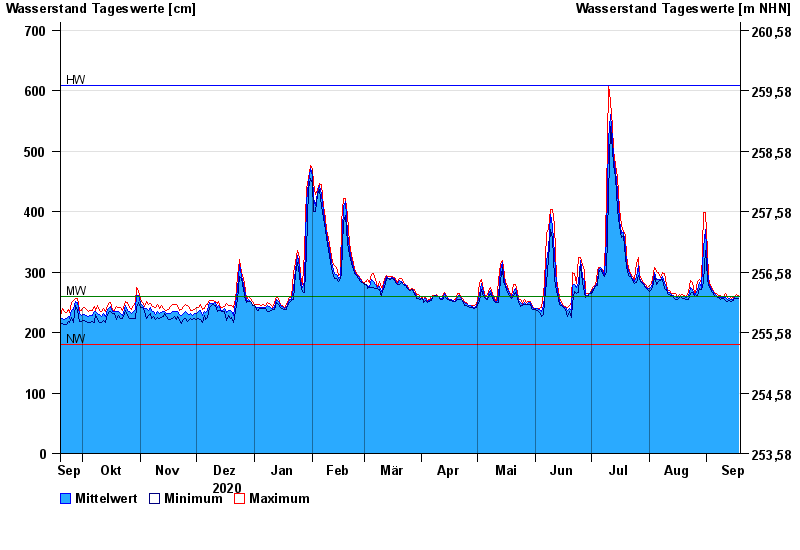
| Date | Mean value [cm] | Maximum [cm] | Minimum [cm] |
|---|---|---|---|
| 18.09.2021 | 260 | 262 | 256 |
| 17.09.2021 | 259 | 263 | 256 |
| 16.09.2021 | 258 | 260 | 256 |
| 15.09.2021 | 255 | 258 | 253 |
| 14.09.2021 | 254 | 257 | 252 |
| 13.09.2021 | 256 | 259 | 253 |
| 12.09.2021 | 255 | 258 | 252 |
© Bayerisches Landesamt für Umwelt 2024