
- Start >
- Rivers >
- Waterlevel >
- Oberer Main - Elbe >
- Langenau >
- Chart of year

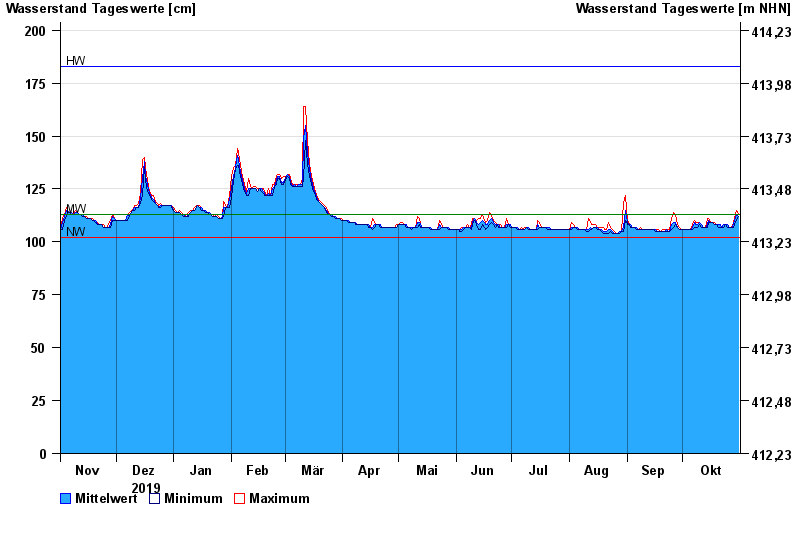
Chart of year Langenau / Langenaubach
Waterlevel from 01.11.2019 to 31.10.2020
| Date | Mean value [cm] | Maximum [cm] | Minimum [cm] |
|---|---|---|---|
| 31.10.2020 | 112 | 113 | 112 |
| 30.10.2020 | 113 | 115 | 110 |
| 29.10.2020 | 110 | 111 | 108 |
| 28.10.2020 | 108 | 109 | 107 |
| 27.10.2020 | 107 | 107 | 107 |
| 26.10.2020 | 107 | 107 | 107 |
| 25.10.2020 | 108 | 108 | 107 |
© Bayerisches Landesamt für Umwelt 2024