
- Start >
- Rivers >
- Waterlevel >
- Oberer Main - Elbe >
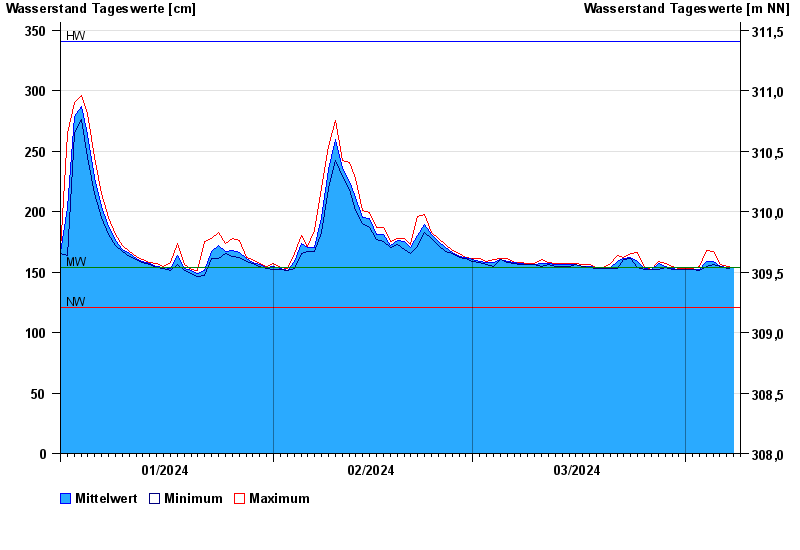
- Kauerndorf >
- Chart of year

Chart of year Kauerndorf / Schorgast
Waterlevel from 01.01.2024 to 08.04.2024
note
Bauarbeiten am Pegel
| Date | Mean value [cm] | Maximum [cm] | Minimum [cm] |
|---|---|---|---|
| 08.04.2024 | 154 | 154 | 154 |
| 07.04.2024 | 154 | 155 | 153 |
| 06.04.2024 | 155 | 156 | 155 |
| 05.04.2024 | 159 | 167 | 156 |
| 04.04.2024 | 159 | 168 | 155 |
| 03.04.2024 | 152 | 155 | 151 |
| 02.04.2024 | 152 | 153 | 152 |
© Bayerisches Landesamt für Umwelt 2024