
- Start >
- Rivers >
- Waterlevel >
- Oberer Main - Elbe >
- Hohenberg >
- Chart of year

Chart of year Hohenberg / Eger
Waterlevel from 01.01.2019 to 31.12.2019
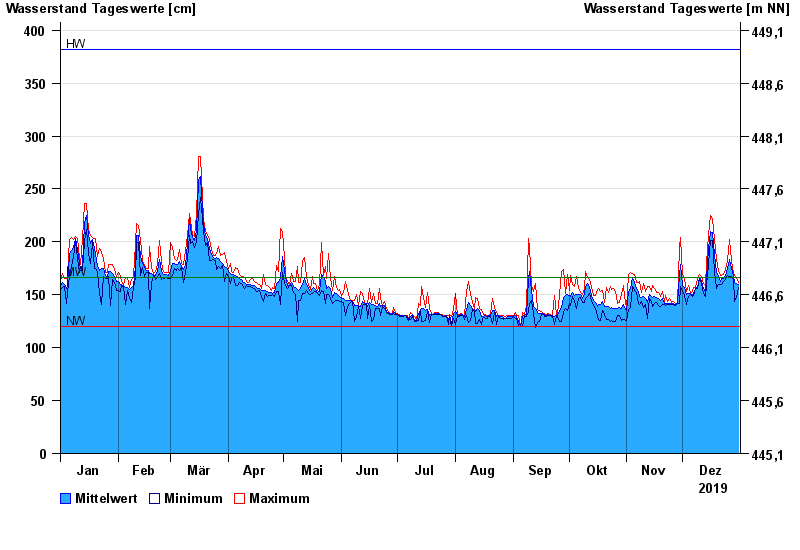
| Date | Mean value [cm] | Maximum [cm] | Minimum [cm] |
|---|---|---|---|
| 31.12.2019 | 160 | 162 | 157 |
| 30.12.2019 | 161 | 166 | 147 |
| 29.12.2019 | 162 | 168 | 144 |
| 28.12.2019 | 167 | 170 | 164 |
| 27.12.2019 | 175 | 182 | 167 |
| 26.12.2019 | 183 | 202 | 167 |
| 25.12.2019 | 175 | 182 | 168 |
© Bayerisches Landesamt für Umwelt 2024