
- Start >
- Rivers >
- Waterlevel >
- Oberer Main - Elbe >
- Hohenberg >
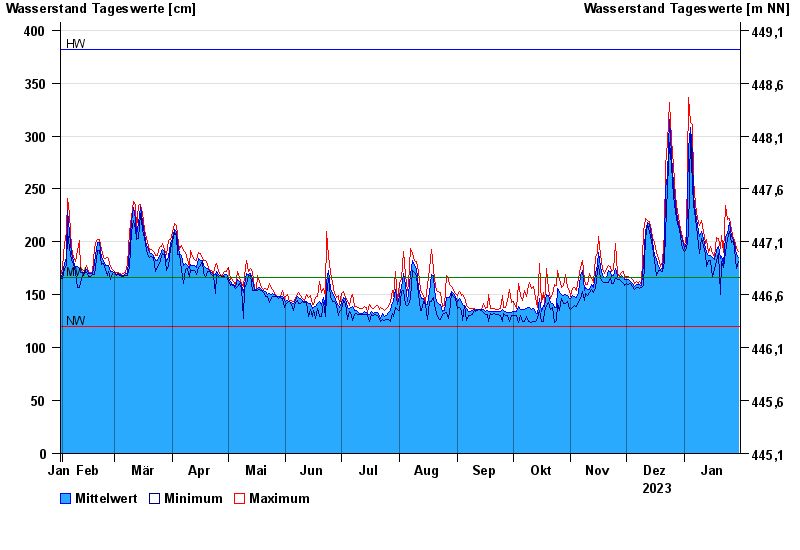
- Chart of year

Chart of year Hohenberg / Eger
Waterlevel from 31.01.2023 to 30.01.2024
| Date | Mean value [cm] | Maximum [cm] | Minimum [cm] |
|---|---|---|---|
| 30.01.2024 | 185 | 191 | 181 |
| 29.01.2024 | 188 | 194 | 175 |
| 28.01.2024 | 198 | 202 | 193 |
| 27.01.2024 | 201 | 202 | 200 |
| 26.01.2024 | 205 | 212 | 199 |
| 25.01.2024 | 218 | 222 | 210 |
| 24.01.2024 | 208 | 221 | 203 |
© Bayerisches Landesamt für Umwelt 2024