
- Start >
- Rivers >
- Waterlevel >
- Oberer Main - Elbe >
- Hohenberg >
- Chart of total period

Chart of total period Hohenberg / Eger
Waterlevel from 05.01.1966 to 19.04.2024
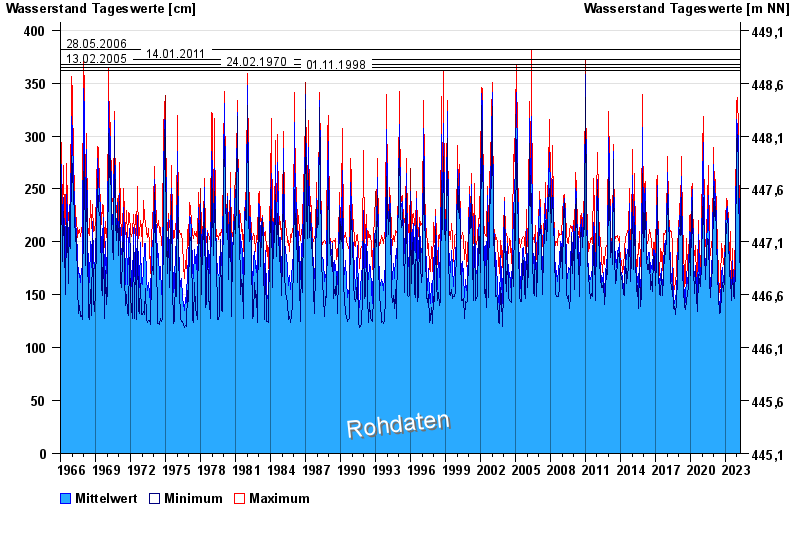
- 28.05.2006 Wasserstand: 382 cm
- 14.01.2011 Wasserstand: 372 cm
- 13.02.2005 Wasserstand: 368 cm
- 24.02.1970 Wasserstand: 365 cm
- 01.11.1998 Wasserstand: 362 cm
| Date | Mean value [cm] | Maximum [cm] | Minimum [cm] |
|---|---|---|---|
| 19.04.2024 | 164 | 166 | 161 |
| 18.04.2024 | 163 | 171 | 155 |
| 17.04.2024 | 165 | 176 | 153 |
| 16.04.2024 | 160 | 165 | 157 |
| 15.04.2024 | 156 | 162 | 152 |
| 14.04.2024 | 158 | 162 | 153 |
| 13.04.2024 | 160 | 163 | 158 |
© Bayerisches Landesamt für Umwelt 2024