
- Start >
- Rivers >
- Waterlevel >
- Oberer Main - Elbe >
- Heinersdorf >
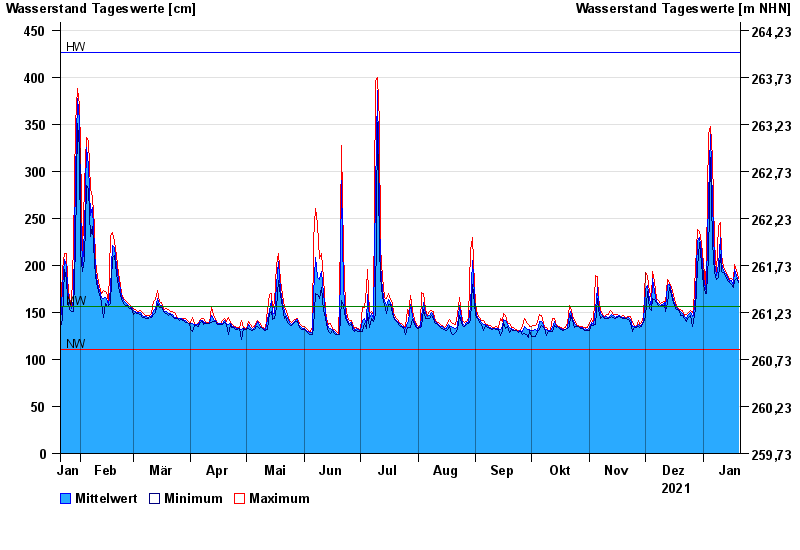
- Chart of year

Chart of year Heinersdorf / Rodach
Waterlevel from 21.01.2021 to 20.01.2022
| Date | Mean value [cm] | Maximum [cm] | Minimum [cm] |
|---|---|---|---|
| 20.01.2022 | 183 | 186 | 182 |
| 19.01.2022 | 189 | 195 | 186 |
| 18.01.2022 | 196 | 201 | 184 |
| 17.01.2022 | 179 | 184 | 177 |
| 16.01.2022 | 184 | 186 | 180 |
| 15.01.2022 | 183 | 185 | 182 |
| 14.01.2022 | 187 | 189 | 184 |
© Bayerisches Landesamt für Umwelt 2024