
- Start >
- Rivers >
- Waterlevel >
- Oberer Main - Elbe >
- Heinersdorf >
- Chart of total period

Chart of total period Heinersdorf / Rodach
Waterlevel from 28.10.1963 to 20.04.2024
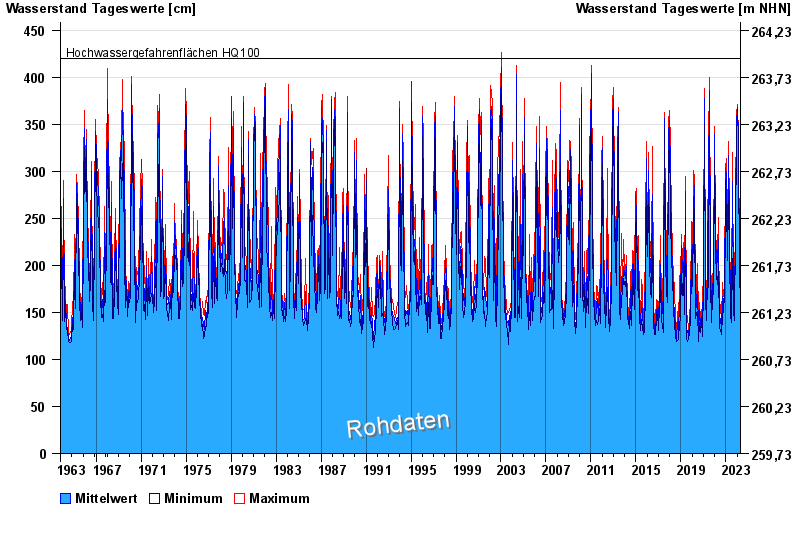
- Hochwassergefahrenfläche HQ100 420 cm
| Date | Mean value [cm] | Maximum [cm] | Minimum [cm] |
|---|---|---|---|
| 20.04.2024 | 180 | 183 | 175 |
| 19.04.2024 | 155 | 174 | 150 |
| 18.04.2024 | 152 | 155 | 151 |
| 17.04.2024 | 156 | 158 | 154 |
| 16.04.2024 | 152 | 157 | 146 |
| 15.04.2024 | 149 | 151 | 148 |
| 14.04.2024 | 150 | 151 | 149 |
© Bayerisches Landesamt für Umwelt 2024